Placeholder

Customer Forum

Opportunity Conversion Rates

Workbooks Support Posted: 2016-03-22 10:20

Did you know about our Success Clinics?

This forum post is discussed in our Reports to Skyrocket your Sales Success Clinic video.

In the Blog post How to Skyrocket your Sales Team's Performance Using these 6 CRM reports - today! the focus was on reports to give real-time information to sales leaders in order for them to make informed business decisions regarding their team's performance. The information below describes how to create the third of those reports: Opportunities Conversion Rates: How successful are your Sales Reps at winning Opportunities?

​​​​ NOTE: You can either build a report from scratch using the steps in this forum post or you can use the template. To find a template choose an option to Create a report from a template report, rather than Create a new blank report. Then, use the filters to find a template called Opportunity Conversion Rates. If you have different stages, make sure you replace %Won% with the relevant name of the stage. There is no criteria restricting the report results to a specific date range, but you can add these as you wish. Conditional styling has been applied as in this forum post, you are able to change the settings if you want.

3. Opportunity Conversion Rates

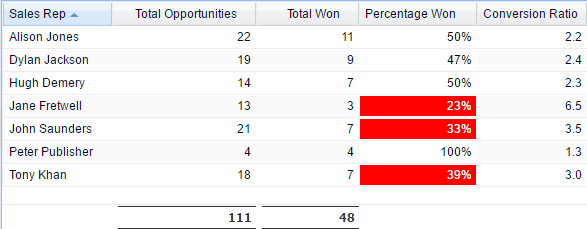
The report below shows how good your sales representatives are at closing deals. For example, Dylan Jackson has brought in a large number of deals, but his conversion rate is not the best (47%), whereas Peter Publisher had the lowest number of deals, but has the best conversion rate (100%). Conversion rates allow you to see which salespeople are the best at winning Opportunities regardless of the number of Opportunities that they have. Information on building this kind of report is available below the screenshot.

  • Start building your Report by choosing the appropriate record type, which in this case is Opportunities. Click on the Details tab and add the columns that will pull through the data you wish to build a report around. In this case add Assigned to name, Stage and Id. You can change the Title if you wish, in this report we changed Assigned to name to Sales Rep.

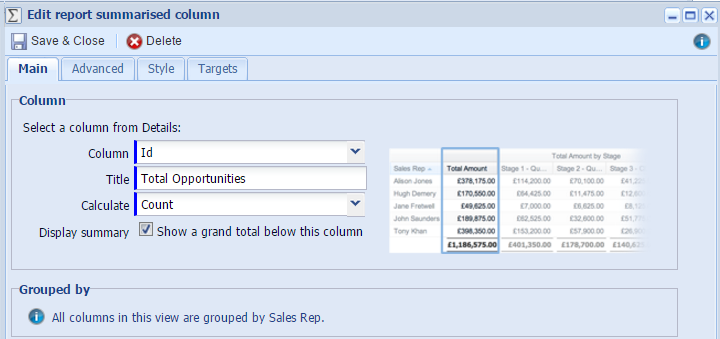
  • Now you want to be able to see how many Total Opportunities each sales person has. To achieve this, click Add Summary View > Add value column > Summarised column and select Id from dropdown picklist next to the Column and Calculate Count as shown in the screenshot below.

  • Now add a Calculated column to see how many of the Total Opportunities are at Won using the following formula:

COUNT(IF( PARENT('Stage') LIKE '%Won%', PARENT('Id'), NULL))

  • NOTE: If you have different stages in your database, you would need to modify the formula above, by replacing %Won% with the relevant name of the stage.
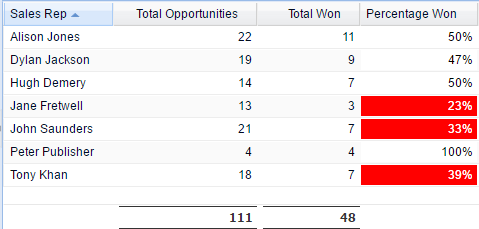
  • Now you have data for your Total Opportunities and your converted Opportunities at Won. To see which Sales Rep has the best conversion rate divide the number of won Opportunities by the Total Opportunities. Add a Calculated column, choose an appropriate Title and use the following formula:

COUNT(IF( PARENT('Stage') LIKE '% Won%',  PARENT('Id'), NULL)) / COUNT(PARENT('Id'))*100

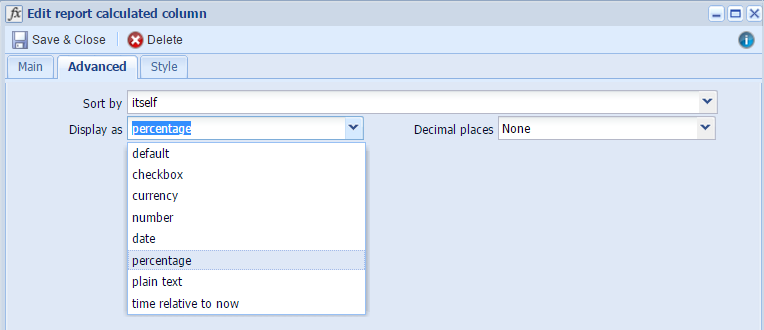
  • You can control how many decimal places are shown and include a percentage symbol. To do this, click on the Advanced tab and select Percentage from the dropdown picklist next to the Display as field as shown below. You can use the picklist next to the Decimal places field to choose the number of decimals you want to be displayed.  

  • You may also want to be able to see overall conversion ratios. You can see from the screenshot below that 48 out of 111 deals are won, or 1 in every 2.3 deals. You can add a column that calculates overall conversion ratios for each sales rep. To do that, add a Calculated column and use the following formula below:

COUNT(PARENT('Id')) / SUM(IF(PARENT('Stage') LIKE '%Won%', 1, 0))

  • This will give you conversion ratios which can be used when reporting on your pipeline. For example, if you know that you win on average 1 in every 2.3 deals, ideally you want the amount in your pipeline to be 2.3 x bigger than your sales target.
  • You can also add Conditional Styling to be able to visually see whose Percentage Won is less than 40%. To do that, you need to click on the Style tab in the Percentage Won column, add Conditional Styling on values, set low threshold to 40 and choose appropriate colours. In this report we chose text colour to be white and background red.

  • You've now got a Report that shows how successful your Sales Reps are at winning Opportunities. By looking at the conversion rates you can see who is your best sales representative. Having this information allows you to distribute Opportunities accordingly and pass some of them from one Sales Rep to another.