|
In the Blog post How to Skyrocket your Sales Team's Performance Using these 6 CRM reports - today! the focus was on reports to give real-time information to sales leaders in order for them to make informed business decisions regarding their team's performance. The information below describes how to create the last of those reports: Sales trends by Client: Which clients have you lost recently?
6. Client Performance Report
This kind of report shows your clients' buying patterns over time. It allows you to identify which customers are new, which ones have stopped purchasing and which ones have increased their spend. Information on creating this kind of report is available below.


-
You'll also need to add two Calculated columns and use IF statements to make sure you're taking into account only those purchases that have been made either Last Month or 2 Months ago (achieved using the INTERVAL statement). Use the following formulae to create two Calculated columns:
IF(document_date BETWEEN DATE_ADD(LAST_DAY(DATE_SUB(CURDATE(), INTERVAL 2 MONTH)), INTERVAL 1 DAY) AND LAST_DAY(DATE_SUB(CURDATE(), INTERVAL 1 MONTH)), order_line_items.home_currency_gross_value,0)
IF(document_date BETWEEN DATE_ADD(LAST_DAY(DATE_SUB(CURDATE(), INTERVAL 3 MONTH)), INTERVAL 1 DAY) AND LAST_DAY(DATE_SUB(CURDATE(), INTERVAL 2 MONTH)), order_line_items.home_currency_gross_value,0)
-
Note, we've used the gross value in this example but if you prefer, you can use the net value, in which case your two formulae would be:
IF(document_date BETWEEN DATE_ADD(LAST_DAY(DATE_SUB(CURDATE(), INTERVAL 2 MONTH)), INTERVAL 1 DAY) AND LAST_DAY(DATE_SUB(CURDATE(), INTERVAL 1 MONTH)), order_line_items.home_currency_net_value,0)
IF(document_date BETWEEN DATE_ADD(LAST_DAY(DATE_SUB(CURDATE(), INTERVAL 3 MONTH)), INTERVAL 1 DAY) AND LAST_DAY(DATE_SUB(CURDATE(), INTERVAL 2 MONTH)), order_line_items.home_currency_net_value,0)
-
Regardless of whether you choose to use the net or the gross value, because we've used an IF function, the results of the two calculations now display as a string rather than a currency. To configure these as currencies, make sure you go to the Advanced tab on these Calculated columns and select Display as currency.
-
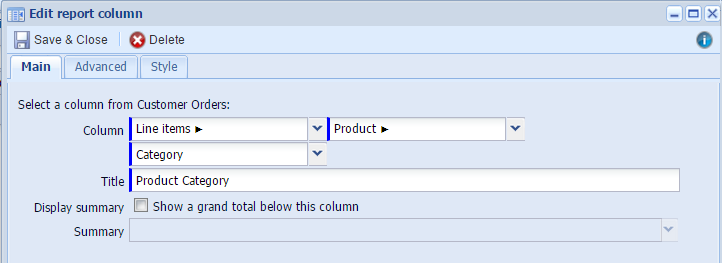
Add a Summary view based on your Details tab. Add two Grouping columns and make sure to group by the Customer with the Grouping order First and then group by the Product Category with the Grouping order After Customer.
-
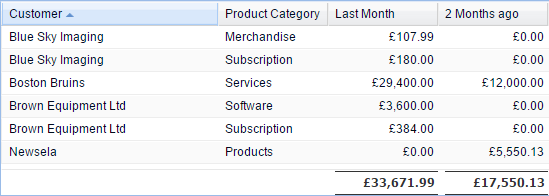
Add two subtotal columns for Last Month, 2 Months ago and choose appropriate Titles. Now when you click Refresh preview, you'll be able to see your customers' buying patterns over a specific period of time.

-
Now you want to be able to see the change in their purchases comparing Last Month to 2 Months ago. To do this, add a Calculated column and use the following formula:
(SUM(PARENT('Last Month'))-SUM(PARENT('2 Months ago'))) / SUM(PARENT('2 Months ago'))*100
-
If you want the results to be displayed as a percentage, go to the Advanced tab on the Calculated column and choose percentage next to the Display as field. If you click Refresh Preview, you'll see some blank fields in the Change column. They mean that a Customer is new and their first purchase was made only last month.

IF(SUM( PARENT('2 Months ago')) = 0, 'New',
IF(SUM( PARENT('Last Month')) > SUM( PARENT('2 Months ago')),'Increase',
IF(SUM( PARENT('Last Month')) < SUM( PARENT('2 Months ago')),'DECREASE','Flat')))
-
This will create a new column and will fill it in with the right values: where a customer ordered a higher value of goods/services last month than they did 2 months ago, the column will show 'Increase' and if the figure has gone down it will show 'DECREASE'. If the customer didn't order anything from you 2 months ago but did last month, the entry will show 'New'. Of course, for your purposes you may want to change the span of months that show in the report.
- You may want to use Calculated Conditional styling to make it easier to see which clients have stopped ordering recently or decreased their spend. Add a Calculated column, name it 'CSS Styling' and use the following formula:
CASE
WHEN (SUM(PARENT('Last Month')) - SUM(PARENT('2 Months ago')) <0 )
THEN 'text-align: center;background-color:Red;color: white'
ELSE 'text-align: center;background-color:White;color: black'
END
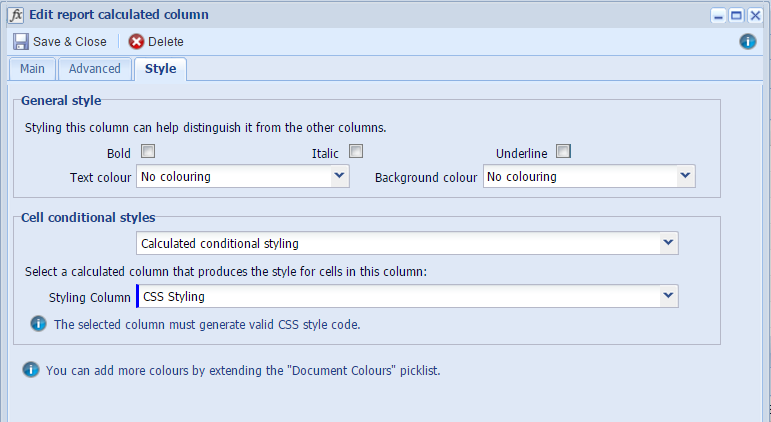
- In this report we chose the calculated column to be displayed in red if a customer last month ordered less compared to 2 months ago. If you don't want CSS styling column to be displayed you can hide it by unticking it on a Summary view. Now, open the Difference column, go to the Style tab, select Calculated conditional styling and CSS Styling as shown in the screenshot below.

|


