


Power BI
Power BI is a business analytics service by Microsoft. It aims to provide interactive visualisations and business intelligence for end users to create their own reports and dashboards. It also allows you to create a dashboard with data pooled from various sources. This means that if you run your company across multiple systems you can use Power BI to see a complete picture of your business.
Power BI can easily get Report data from Workbooks, using this data you can either build an entire dashboard using the visualisation tools that Power BI offers or combine it with data from other sources to create a dashboard that spans the business.
Below you will find a step by step guide on how to bring Workbooks information into the Power BI Desktop, once the data is within the Power BI Desktop it can be pushed to the web for those with a Pro account.
Step 1 – Create an API Key
In order for the integration to work, a setting not available to end users must be enabled. Please contact support@workbooks.com to do so.
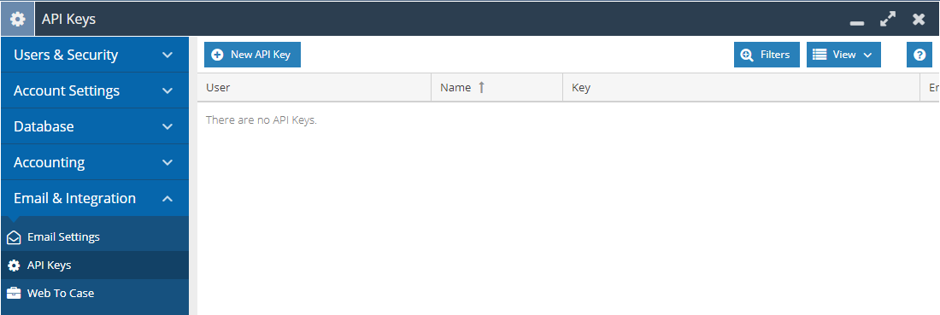
You will need to create an API Key that can access the required Reports, to do this go to Start > Configuration > Email & Integration > API Keys, from this view select New API Key.
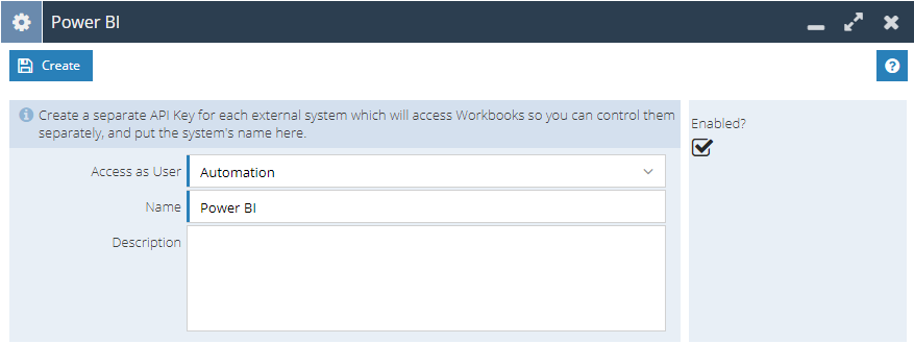
A new window will appear to configure the API Key, here you will need to fill out the following information:
Access as User: The User the API Key will be accessing the system as; we recommend using the Automation User as this will be able to access all Reports within the system and will not have issues with logins to the system.
Name: Give the API Key an appropriate name such as Power BI so you can easily identify the purpose of the API Key in the future.
Once these have both been populated, press the Create button, this will create your API Key as well as a section at the bottom of the page allowing you to give the API Key capabilities. This API Key will need the following Capabilities:
- API Access
- Export Reports
- View Reports
Note: if you do not give the API Key any capabilities it will have full access to the system, for security reasons we recommend only providing API Keys with the minimum level of capabilities required.
Step 2 – Create the Report URL
You will now need to create a Report URL that will be loaded into Power BI. You will need to create a link for each Report view used, meaning that if your Report has five Summary Views you will need to create five URLs. In this instance you may want to sync the Details view of the Report across and build the Summary Views within Power BI itself.
To create the URL you will first need to edit the Report you want to send to Power BI. Then select the specific view such as Details or Summary, on this view select the Automation tab and press the API Reference button.
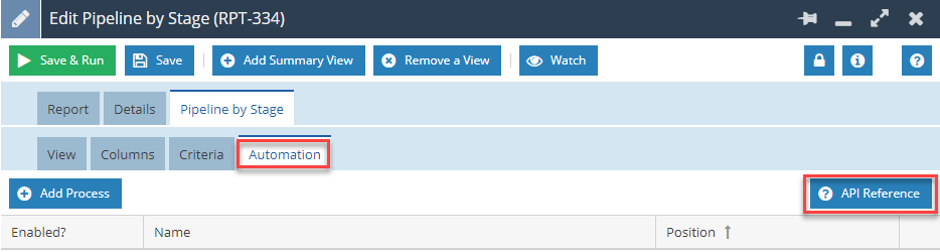
This button will open a new tab in your browser that will show you the API Reference of that Report. You will now need to modify the URL of this webpage.
The webpage should provide you with a URL that looks like the below:
https://secure.workbooks.com/data_view/123/data/metadata.html
You will need to remove the /metadata.html and replace it with .csv?api_key=XXX where XXX is the API Key you created for Power BI.
For example:
https://secure.workbooks.com/data_view/123/data.csv?api_key=79a30-8db49-b0f20-f5869-541a1-0fe74-1bb9d-873f8
Note: You may want to copy and paste this to a notepad or similar until you have entered it into Power BI.
Step 3 – Connect Power BI to the Report
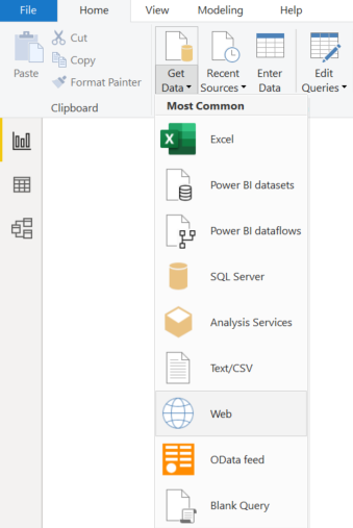
You will now need to load Power BI Desktop and from the Home bar select Get Data, from this list select Web.
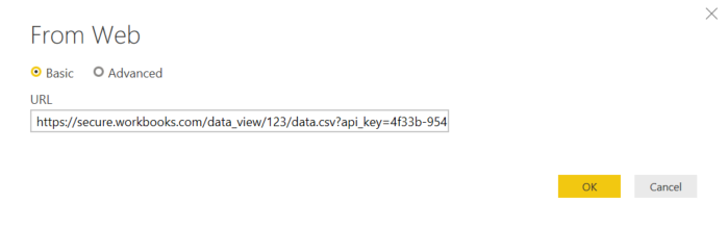
This will open a new dialogue box; here you will need to enter the URL created in Step 2, then press OK.
You will now need to provide anonymous access in order to access the web content. Here you will be able to select options from the entire database URL down to the specific Report.
Providing anonymous access to the database (the default option) means that any other URLs used in this way in the future will be loaded automatically.
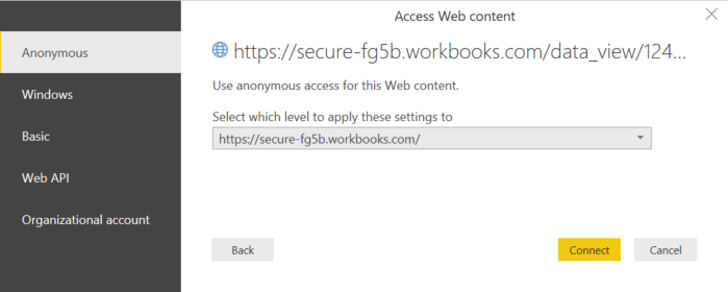
Once you have selected the access you would like to provide, select Connect. This should now load the data from the Report which can either be transformed or loaded directly into Power BI.
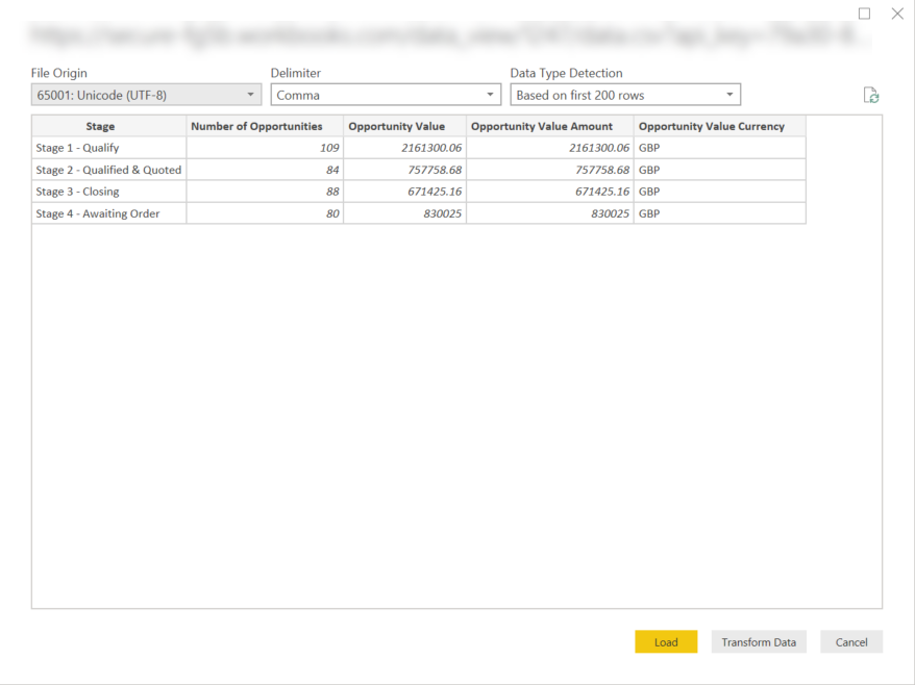
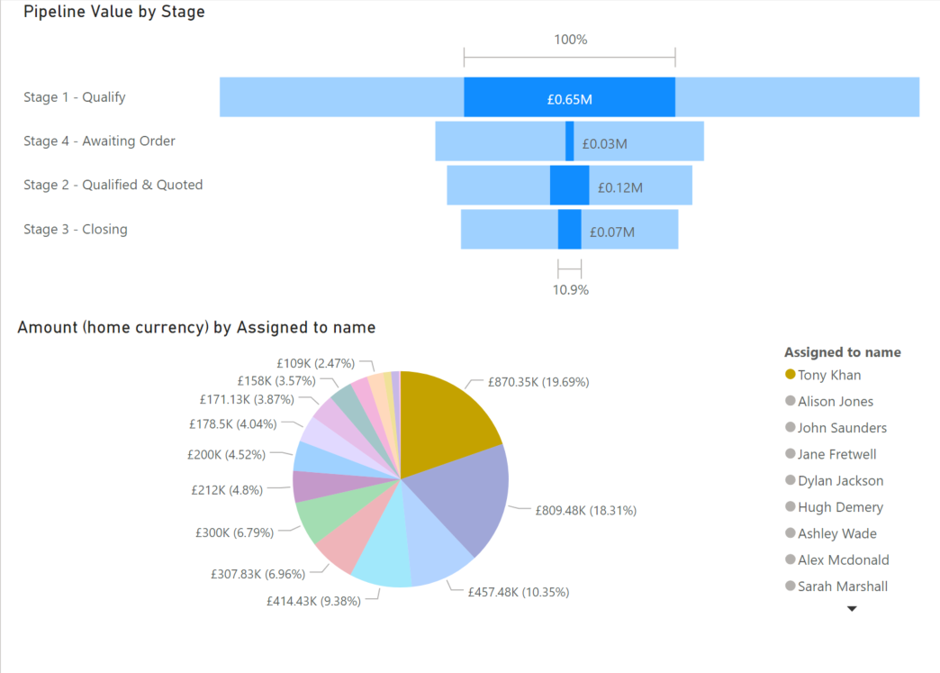
Now that your Workbooks Data is in Power BI you can start to create Dashboard Elements or whole new Reports using their functionality.