Dashboard Fields
Dashboard Fields allow you to apply a filter to multiple elements within your Dashboard simultaneously and then apply them in bulk. This can be used when you want to see an individual’s performance when looking at the performance of a team, or activity for a specific month from a Dashboard that reviews annual performance, for example.

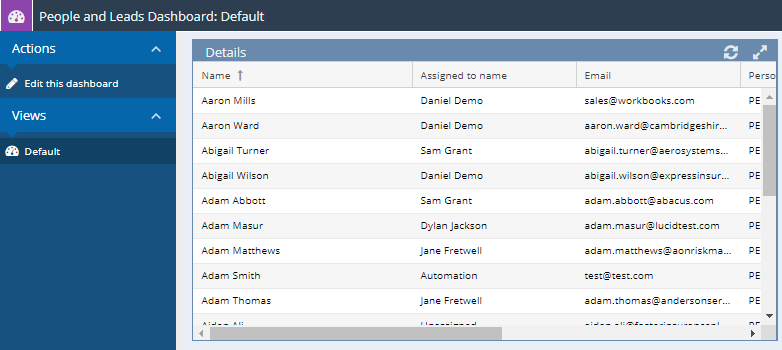
To add a Filter to a Report, go to Start > Dashboards and then open your Dashboard. You should then see the option to Edit this dashboard.
Before a Filter can be applied you will need to set up Field Mappings. These Mappings allow you to decide which Column in each Report will have the Filter applied to it. These can be added and reviewed from the Fields tab of the Dashboard.
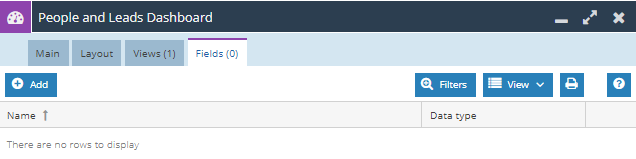
To add a new Field Mapping choose the Add Button on the Fields tab. This will create a new dialogue box that allows you to provide a Name and Data Type of the Mapping.
Name: The name of your Field Mapping
Data type: The type of input that will be used in your Field Mapping, such as String (Text), Integer, Checkbox or Map Position.
Description: A Summary of the Mapping and how it is intended to work.
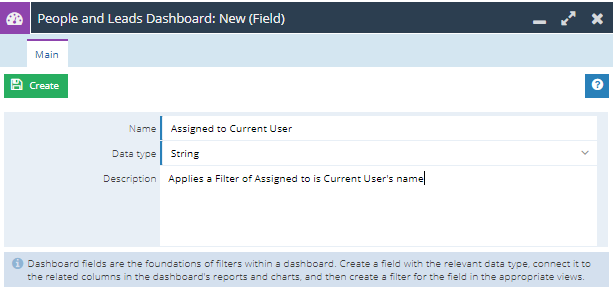
Once you have a Name and Data type you can then use the Create button to produce two new Tabs: Field mappings and View filters, you will need to work through these two Tabs in order to fully set up the Filters.
Field Mappings
First open the Field Mappings Tab, this is used to set up the mapping between the Report Views and the Field you have created on the Dashboard.
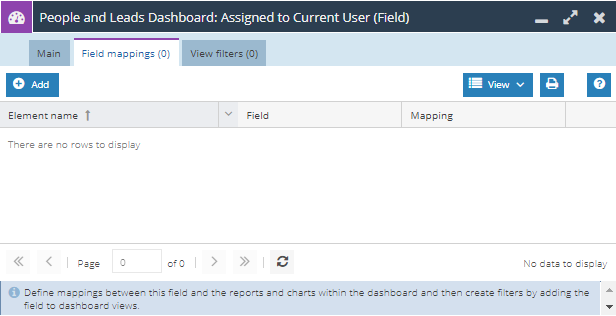
Any existing Field Mappings can be reviewed from this Tab and new Mappings can be created by using the Add button.
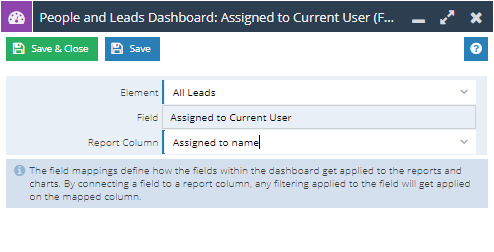
To create a Field Mapping you will first need to select the Element you want to map; this can be either a Report or Chart. The Field will remain read only as this is the Dashboard Field that this will be mapped to. Finally, select the Report Column that you want to map this Field to.
Example – setting up a Dashboard Field
In the example below, the Element is the All Leads Report from the Dashboard, and we’ve selected the Assigned to name column from within that Report as the one that will have the filter applied to it through the Field Mapping.
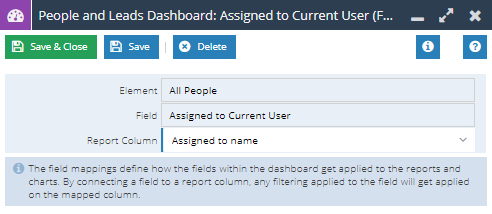
If you have multiple Elements (Reports or Charts) in the Dashboard which you would like to map to this Field you will need to repeat these steps again, once for each Element.
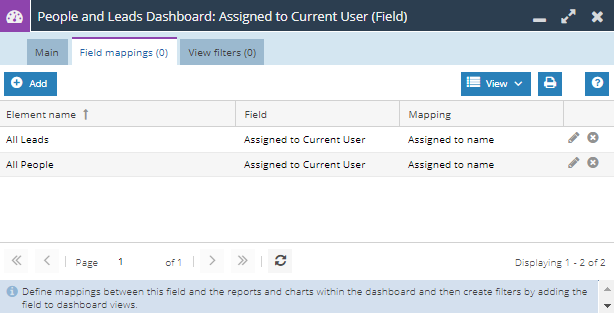
Once all of your Elements have been mapped you can review these from the Field mappings tab, and edit or remove these as required.
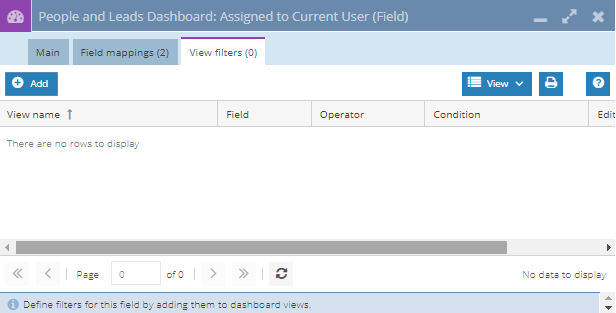
The final step is to apply this Field mapping to a Dashboard View (the same Dashboard Field can be applied to some or all of the Views as needed). From the View filters tab, you can review any existing Views that the Dashboard Field is applied to or select Add to set up the Dashboard Field on a new View.
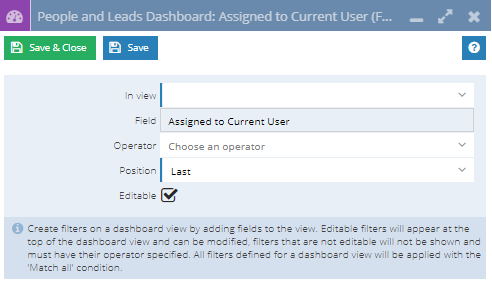
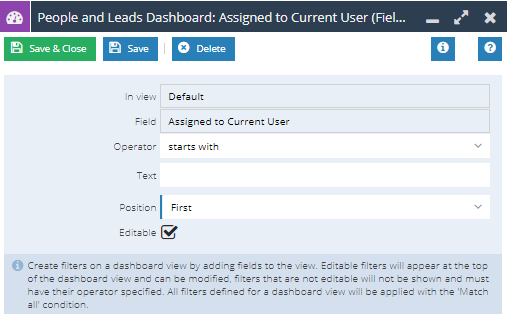
Once you click Add, you will be able to decide which Dashboard View the Dashboard Field will appear in. Like Field mappings, if there are multiple Views that you want to add the Dashboard Field to they will need to be each added separately. The Operator allows you to select the filter operator such as “Starts with” or “is in calendar range” and these Operators will vary depending on the Data type selected when setting up the Field initially.
Once you have selected an Operator this will create the Filter that can be applied to the Dashboard Field as needed. If the Editable field is checked, this will be used as the Default value and applied when the Dashboard is ran. If the Editable box is not checked then the value entered in this Field will be read only and Users will be unable to change this when running the Dashboard.
Once the Field has been set up as required return to the Main tab and Save & Run the Dashboard.
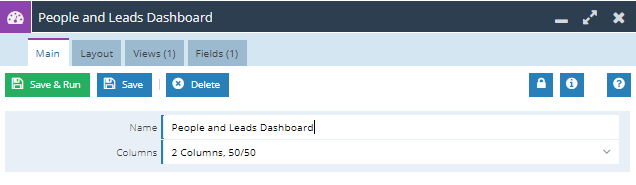
The Dashboard field will now be available for filters to be applied across the Reports and Charts.
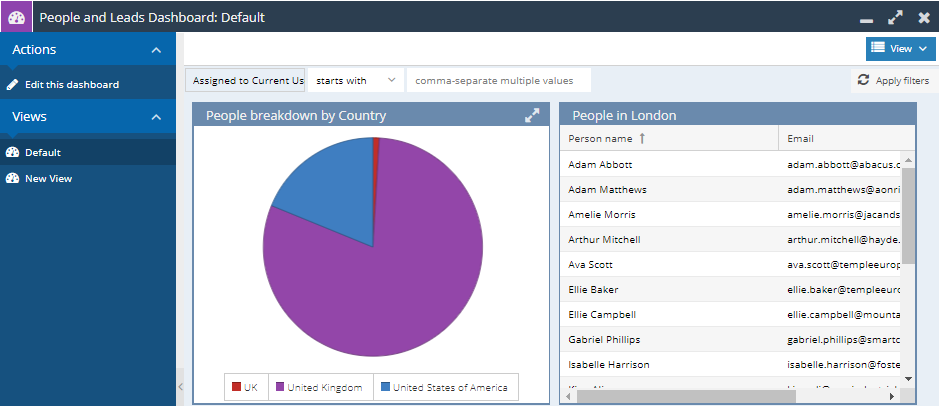
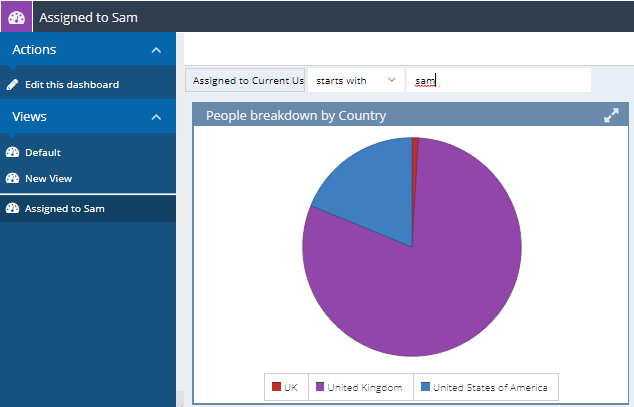
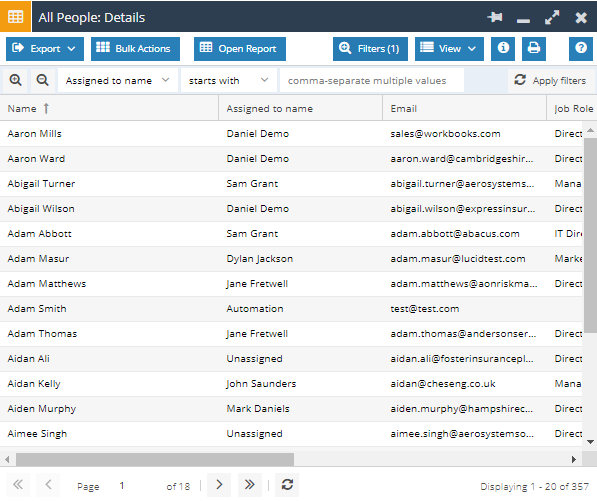
These Filters will also be present on any of the Elements where the Field mapping was set up when the Element is expanded out from the Dashboard itself.
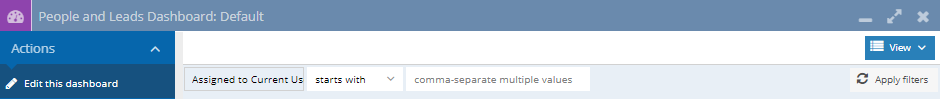
When a Dashboard Field is available on a View, the View button will appear like it would on a regular Landing Page, this has all of the same functionality as a Landing Page; allowing Users to create new Custom Views, name them and set them to the default view as needed.
Once a custom View is created it will be added to the sidebar menu: