


Dashboards
An overview of what Dashboards are and what kind of information they can store.
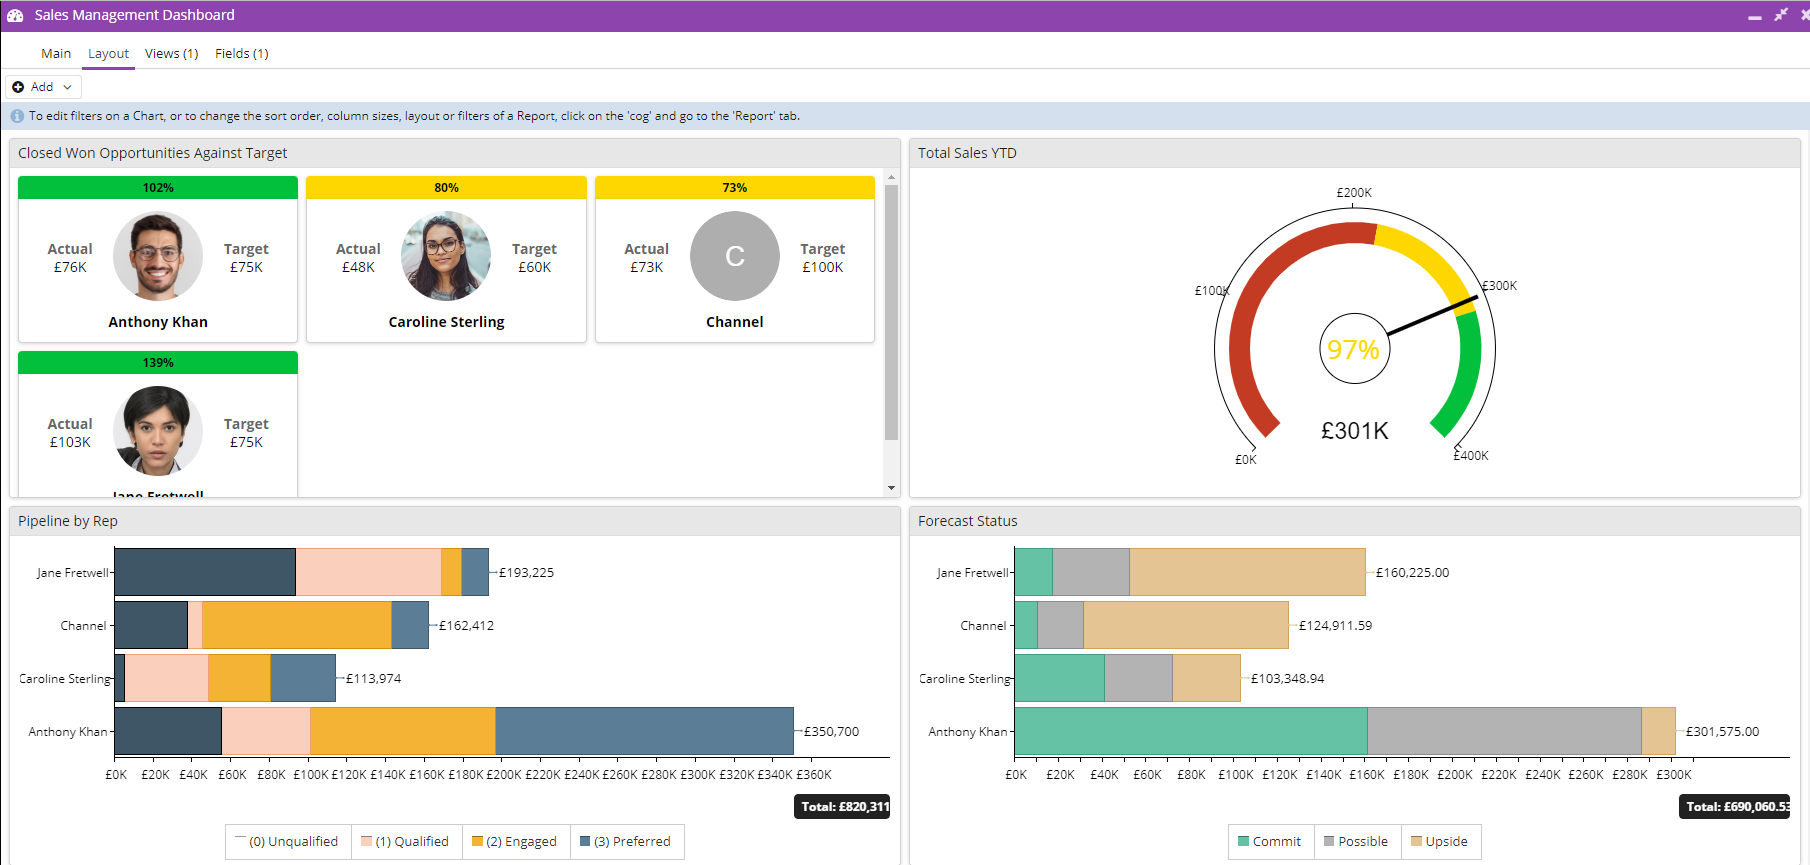
Dashboards offer you a real-time, holistic view of your business; they can show you selected reports, charts or other elements in an easy to read and understandable format.
A Dashboard can display a number of different items allowing you to gain complete visibility of specific business areas with ease. Examples of how Dashboards can be used include: pipeline management, case handling, or tracking the financial health of your business.
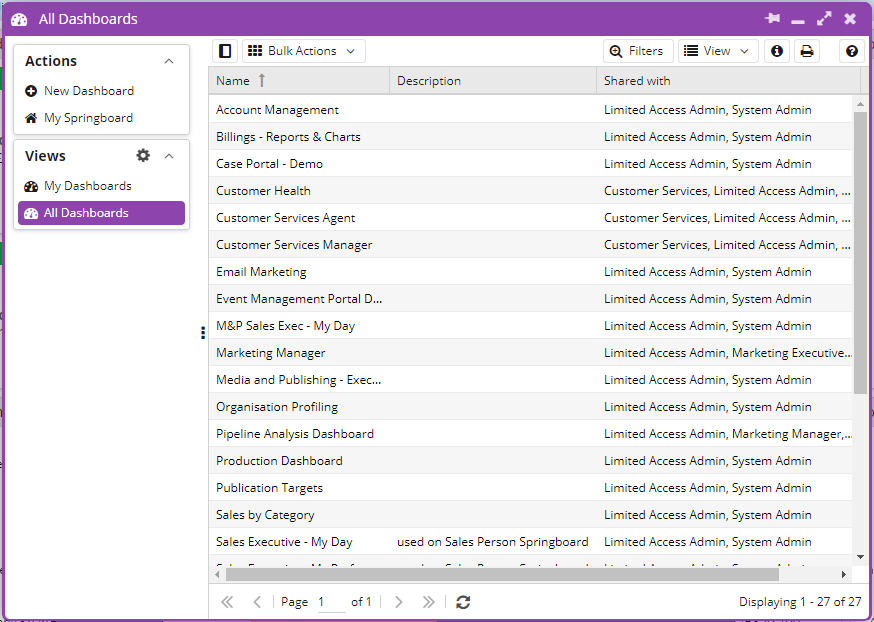
Dashboards can be created or modified from the Dashboard Menu, which is found from Start > Dashboards, or from the Start Menu, Start > New > Dashboard. A new Dashboard can then be added using the New Dashboard Button, and existing Dashboards can be reviewed from the All Dashboards or My Dashboards Views accordingly.
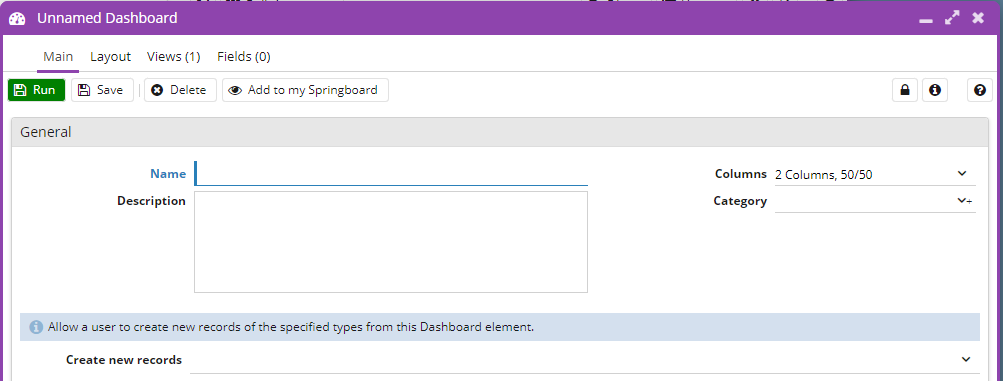
Using New Dashboard will open a new a window which allows you to add a Name, Description, Category, and decide the column layout of the Dashboard. This includes the number of Columns in the Dashboard as well as the ratio of space each column uses. These can be changed at a later date if you decide you want to rename your Dashboard or change the layout of the Columns.
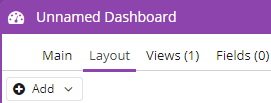
Once you have set this up, you can start adding elements to the Dashboard. These are added from the Layout Tab, using the Add Button.
There are five different types of elements that can be added to a Dashboard:
- Charts: Charts provide a pictographic output of a specific Report View, these can be further filtered or amended as required once added to the dashboard.
- Reports: Report Views can be added to the Dashboard so that results from a number of different reports can be easily referred to in one place.
- Landing page views: Landing page views give you quick, lightweight insights into your data.
- Web Pages: Specific Web Pages that may provide regular updates, such as an overview of the service status can be added to the Dashboard.
- Web Processes: A Web Process, such as a Case or Lead allocation Script, can be called directly from the Dashboard.
Check out this overview of the latest Dashboard and Reporting enhancements from 2022:
More information on Adding Dashboard Elements can be found on the Knowledge Base.
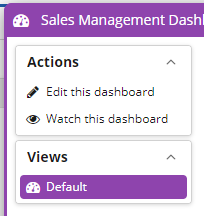
Dashboard menus are hidden by default. However, you can select this button to view:
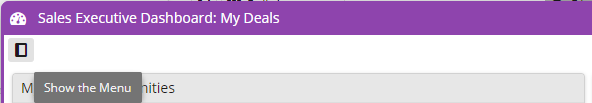
Alternatively, it can be viewed from the icon menu:
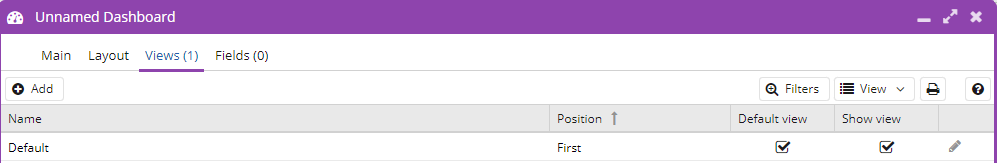
Views
When creating a Dashboard, a View called Default will be created automatically for you, this is where specific Filters and Field Mappings can be added. This allows you to create multiple views for different Users from the same Dashboard such as a View for different Sales Teams. Rather than creating a different Dashboard for each Team the same Dashboard can be used with a different View applied.
More information on the configuration of Views can be found on our Adding Views to Dashboards Knowledge Base page.
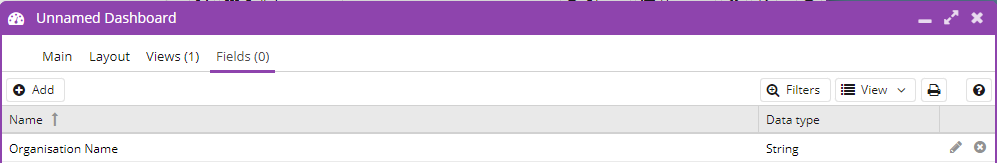
Fields
The Fields tab allows you to set up Filters over a number of different Dashboard windows, these can be applied to any of the Views setup on the Dashboard as needed.
We have more information and examples of Field Mappings and filters on our Knowledge Base page, Dashboard Fields.
Dashboards with multiple columns will automatically display a single column when you resize them.