


GatorSurvey
What is GatorSurvey?
GatorSurveys allow you to create customer-facing surveys with multiple question types. A direct link to the survey can be included in an email or alternatively Surveys can be embedded on a web page via an iFrame. When the form is submitted, the information entered is fed back into Spotler and then into Workbooks. The individual responses are reportable within Workbooks.
GatorSurveys combined with Workbooks offers:
- Easy to use drag and drop interface (similar to GatorCreator).
- Multiple question types, eg star ratings, grid inputs, etc.
- Page conditions and rules – for example if someone gives a score of 6 or less, they are taken to one page but if they score 7 and above, they are taken to a different page.
- Trackable responses within Spotler and Workbooks.
- The ability to report on individual responses.
- The option to edit published surveys to make new revisions and deploy those.
- The inclusion of data from a contact record into the survey (although the responses cannot be written back to the contact).
Why use GatorSurvey?
They can be used at any point of the customer journey to obtain direct feedback from your customers, which is a great way to improve your services and offerings, retain customers and improve loyalty. For example:
- NPS surveys to see how loyal your customers are to your brand and how well they think you’re doing.
- Product or service feedback – get details on how well customers feel a product or service has met their needs and use their feedback from compelling use cases, testimonials and reports, driving further adoption and commitment.
- Get direct input on your content – customers can provide details about the types of marketing activities they’d like to hear about. Can be used to feed preference centre changes.
- The surveys are integrated directly with Workbooks so you can report directly on the survey responses and take action on those responses.
How to set up a a GatorSurvey
Within the GatorSurvey module, click Create New Survey. Here you can create a blank survey or use one of the online templates to give you a headstart. You’ll need to give your survey a name before being taken to the survey builder area, which provides a drag and drop editor, very similar to the GatorCreater interface. More information on using the editor is available on Spotler’s site here.
You can use the Live Preview option to see your survey and nothing will be written back to your system but note that the conditional rules will not operate.
Testing your GatorSurvey
Before making your survey live you should test it. You can use the Direct Test Link or alternatively you can send an email of the current build version. When testing a survey your results will not be recorded but the page conditions and rules will function.
NOTE: The URL that’s generated for your test will have the suffix of t=1. DO NOT use this for your live survey as the results will not be written back to the system.
Using a Survey
When you’re happy with your testing you need to publish your survey using one of the following methods:
- Direct Link – this is the most common approach and generates the URL that you can include in the email against one of your GatorMail campaigns. This can be a text link or a button, depending on what you want your email to look like.
- Social Network – you can share the survey to Twitter, Facebook, LinkedIn and Google+.
- Embed within an iFrame – this will generate HTML code that your web developers can insert into one of your hosted web pages.
NOTE: If people complete the survey via the Social Network or iFrame methods, the results will NOT appear in Workbooks. The only way to get the results to appear is if you’ve published your survey via a direct link in a campaign. However, in all publishing methods, the results will show against the survey within GatorSurvey.
Reporting on Survey Results and Responses
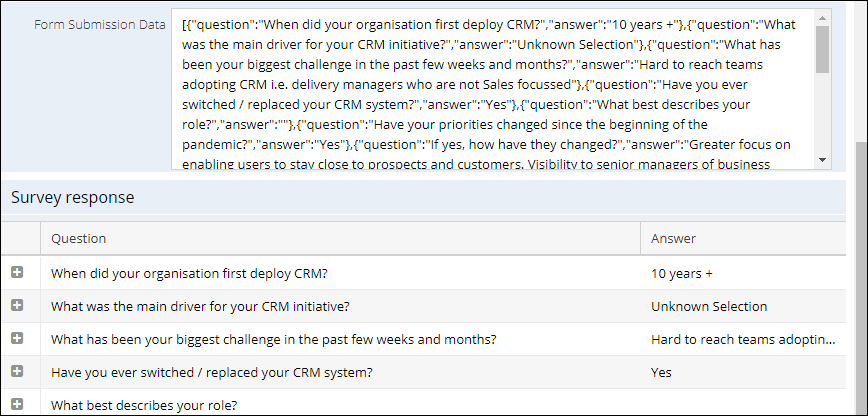
As soon as the GatorSurvey module is enabled on your account, the process of sending GatorSurvey-specific Online Activities back into your Workbooks system will be automatically setup and configured. When a recipient clicks to open the survey, an Online Activity of type Survey Accessed will be created. If the recipient completes and submits their responses, an Online Activity of type Survey Response will be created. This contains JSON code of their responses and shows the individual responses below the form submission data, as shown in the screenshot below.
In addition, an Online Activity of type Survey Completed will be created.
In order to use this data, you will want to report on it and therefore you will need to install a secondary scheduled process to format the responses and create a custom record type for survey responses. Please see steps here
Survey Response records enable you to create reports showing who has or has not completed the survey so you could, for example, send a follow-up to people who have started but not completed it.
Whilst the survey responses in the Online Activity of type Survey Response are ‘readable’ to the human eye, in order to view and report on individual survey responses, a script must be deployed on your system by the Workbooks Professional Services team and this means you must have a licence for custom records as the result are held in a custom record called Survey Response. The script can be run on a schedule and looks at the Online Activities of type Survey Response. It splits out the responses into individual Survey Response records. When the script is deployed, we also provide a report that allows you to report on the individual answers and responses. This means, for example, that you could email anyone with an NPS score of 6 or below with one type of content and a different type for people who have scored 9 and above.