January 2019 Release
Release date: 19th January 2019
Charts
Our new Charting engine is now available for all Customers. Not only does this include a much fresher look and feel to how Charts are displayed, but also includes a number of new settings and functionality to allow you to get the most out of your Reports and how they are visualised.
Changes in Design
All of our Charts have been updated to look and feel more modern and presentable. With this change also comes a variety of colour schemes and different ways to present your data.
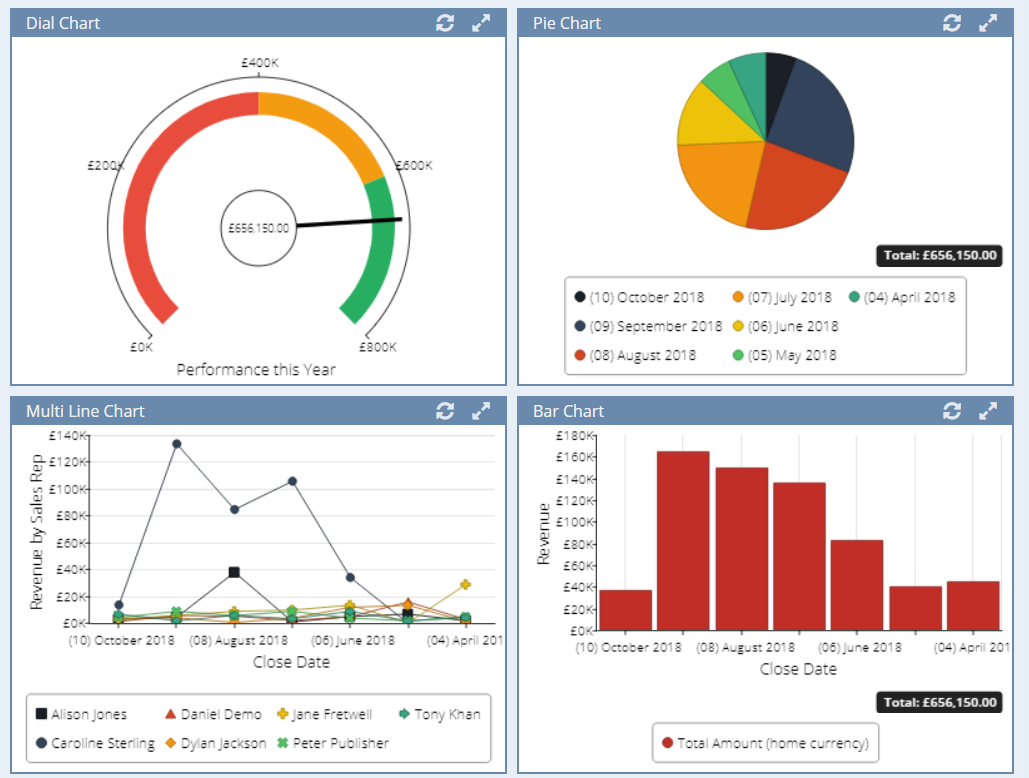
Information on how these Charts can be setup including an overview for each Chart type is found on our Knowledge Base.
Chart Settings
Charts are now more configurable and customisable, each type of Chart having their own settings to allow you to get the most from how you display your data. This can include presenting a split Column in a Stack rather than side-by-side as a Bar Chart, displaying a Pie Chart as a Donut or filling an area under a Line Chart.
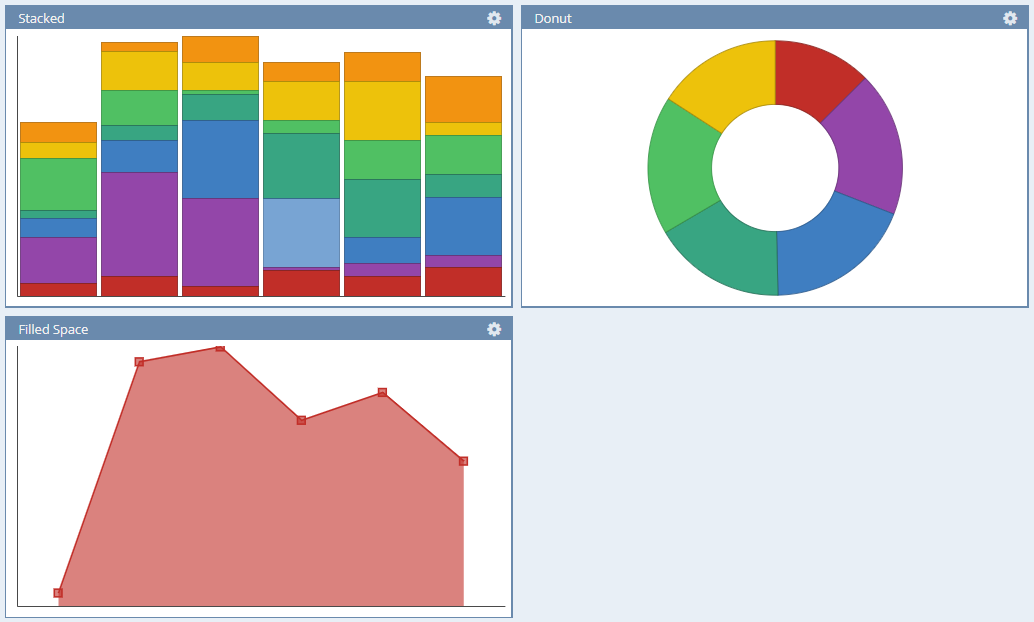
Details on all of the settings for each of the Chart types can be found fully documented on our Knowledge Base.
Filters on Charts
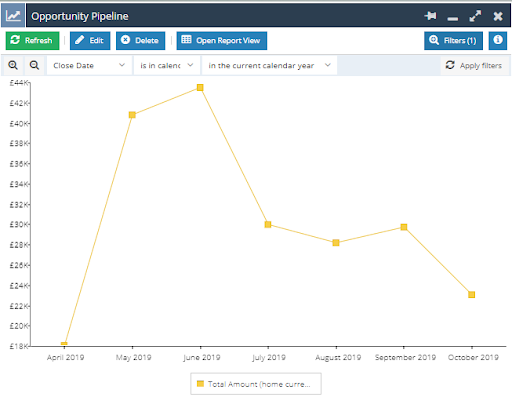
When viewing a Chart you can reduce the data down further by applying a Filter to any Column within the Report View. All Charts come with a Filter button that can be applied in the same manner as a Landing Page or Report.
Drill through Charts
Similar to drilling into a Report it is possible to drill into a specific subset of a Chart. When you right-click on a marker or segment of the Chart, a menu will appear providing you with the option to drill into subsets of the data for that specific section.
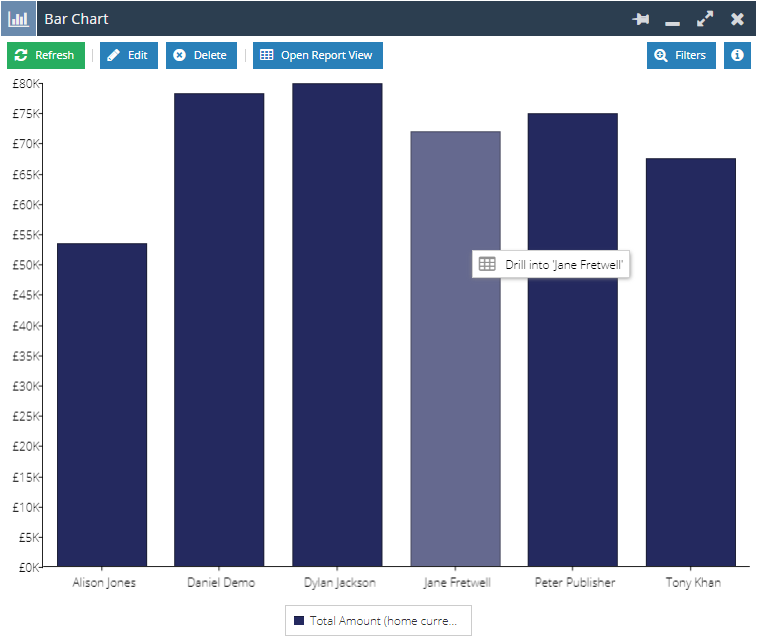
Selecting this will cause a new Report window to open, displaying the Report View that the Chart is based on with appropriate filters applied to the show the data you are drilling into, in grid form.
Targets on Charts
If a Report includes a Target this can now be shown within a Bar Chart and even include the CSS Styling. This provides you with a visual representation of how well a Team or individual is performing against their Target.
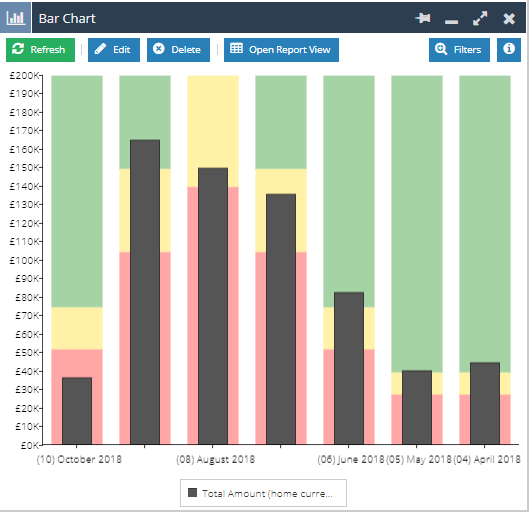
Information on how these Charts can be setup and displayed is detailed on the Knowledge Base.
Dashboards
We have made considerable changes to Dashboards and how they can be edited and presented. Dashboards can now be filtered, this filter can then be applied to multiple Elements across the Dashboard.
This means that a single Dashboard can be presented in a variety of ways to different users, rather than having to create multiple Dashboards from different Report Views.
We have summarised these changes below, and have a worked example of how to set up a Dashboard with all of the new functionality in our Knowledge Base.
Edit Dashboard
In order to Edit a Dashboard you will first have to select the Edit this Dashboard Action from the Menu. Dashboard Elements can no longer be accidentally reordered or deleted without explicitly editing the Dashboard.

Edit Dashboard Details
It is now possible to Rename Dashboards and change the number of Columns and their width once the Dashboard has been setup. These options are found in the Main tab when editing a Dashboard.

Dashboard Fields
Dashboard Fields allow you to create filters that can be applied across multiple Reports and Charts the entire Dashboard.
This can be used when you want to see how an individual within a Team is performing; rather than create a new Dashboard to monitor that individual you can apply a Filter like you would for a Landing Page.
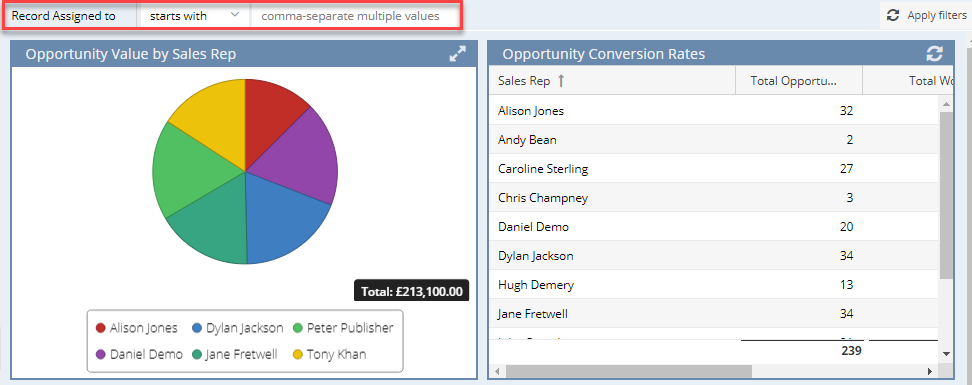
More information including how to setup and configure a Dashboard Field can be found on our Knowledge Base.
Dashboard Views
Dashboard can now have multiple Views applied to them, this allows you to present the same set of data in a number of different ways. When combined with Dashboard Fields and filters, a single Dashboard can become multi-purpose and present data differently for users as required.
This allows you to create a single Dashboard for Sales Performance and then apply a different View for each Sales Rep or Team to see how they are performing separately.
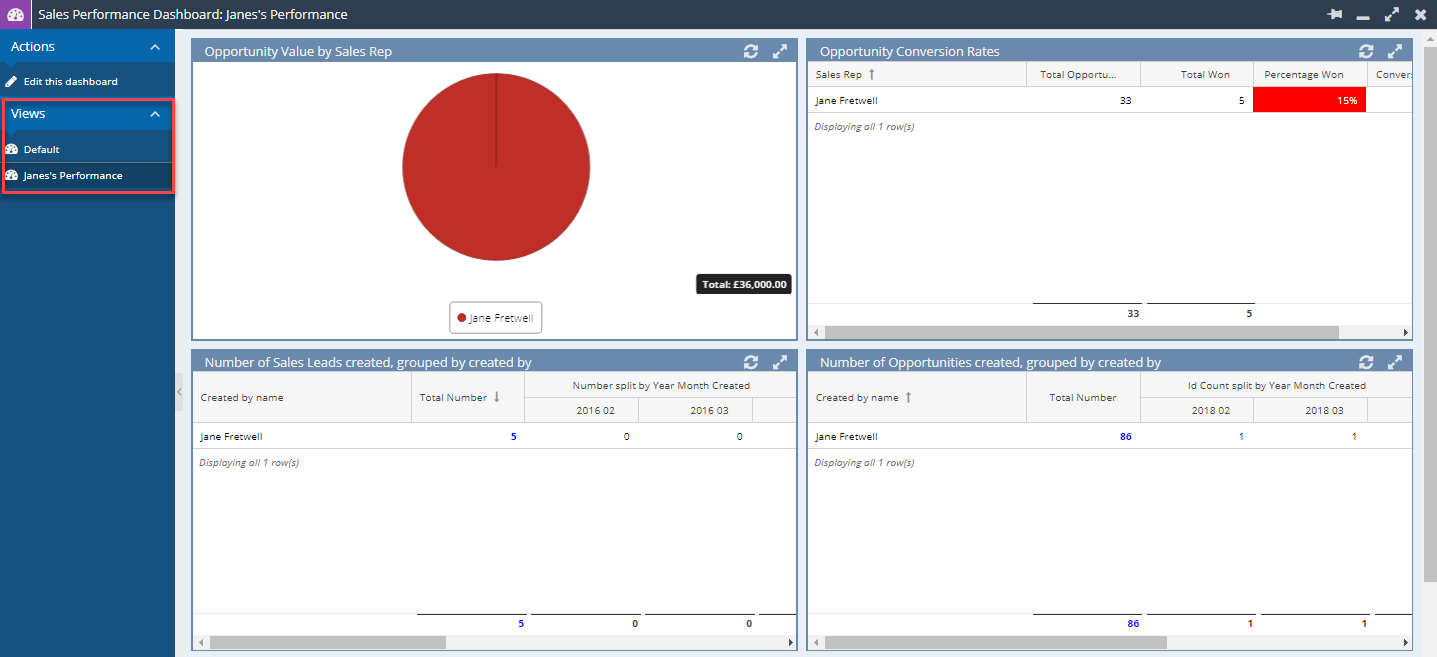
Further information on the setup and configuration of Dashboard Views can be found on the Knowledge Base.
Filter Reports / Charts
When adding a Report or Chart element to a Dashboard you will be able to preview the Report contents in the Report tab. From this tab you can apply Filters to the data and change the sort order of columns. Any changes made here will be applied to the Report or Chart displayed in the Dashboard.
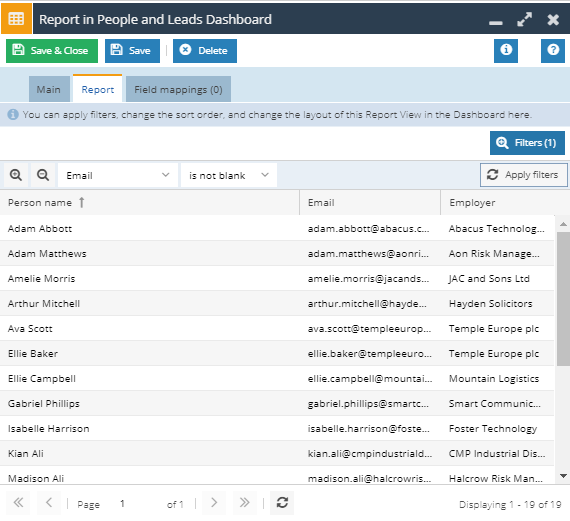
This means that the same Report could be added to a Dashboard multiple times with different filters applied to display subsets of the information.
Limit Report Results on a Dashboard Element
This setting is found on Chart and Report Dashboard Elements and allows you to configure how many rows within the Report are generated based on sorting order of the columns in the Report.
When creating a Report Element the default View for Users is to see the number of Rows specified in the List section of their Preferences. Limiting the Results means that all Users will see the same number of rows within the Report regardless of their Preferences.
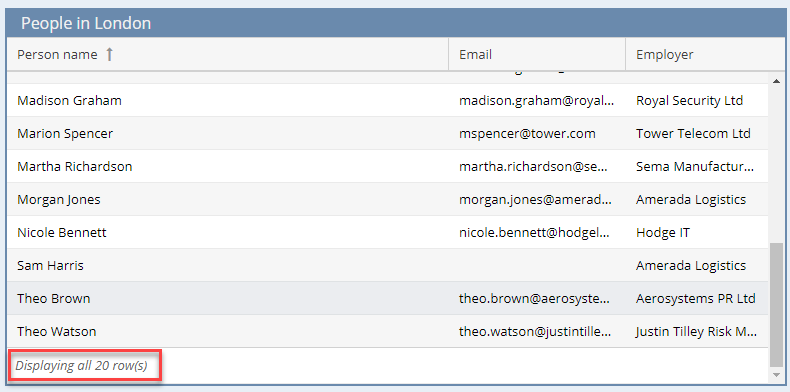
This can then be overwritten so that Users only see the top 10 or 20 results within the Report. Users will be able to see whether their results have been limited by viewing the number of rows shown at the bottom of the Report.
Control Refresh and Expand Settings of Dashboard Elements
It is possible to configure whether a Dashboard Element can be refreshed or expanded when viewed by a User. This means that you can prevent a User from expanding a Report or forcing unnecessary refreshes. Expanding the Report will cause it to open in a new window and view the Report as it does within the Dashboard, complete with applied filters.
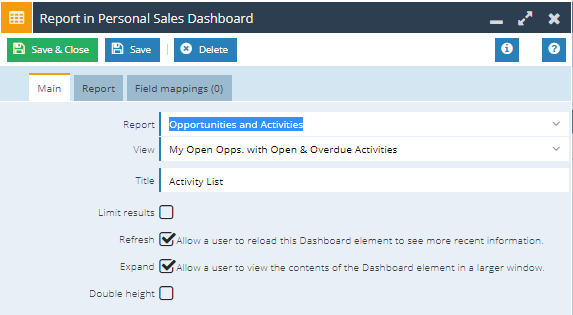
Double Height Setting added to Dashboard Elements
This setting is found on all Types of Dashboard Elements. Enabling the Double height setting amends the element so that it is twice the height of a standard Dashboard Element.
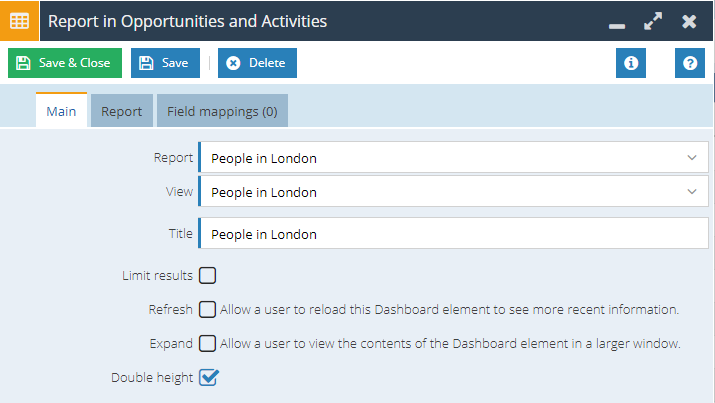
This may be especially useful for Reports that have a large number of Rows as it will reduce the need for scrolling through the Report.
Dashboard as a tab
Dashboards can now be added as a Tab to Records allowing you to see an entire filtered view of Dashboard from within that Record.
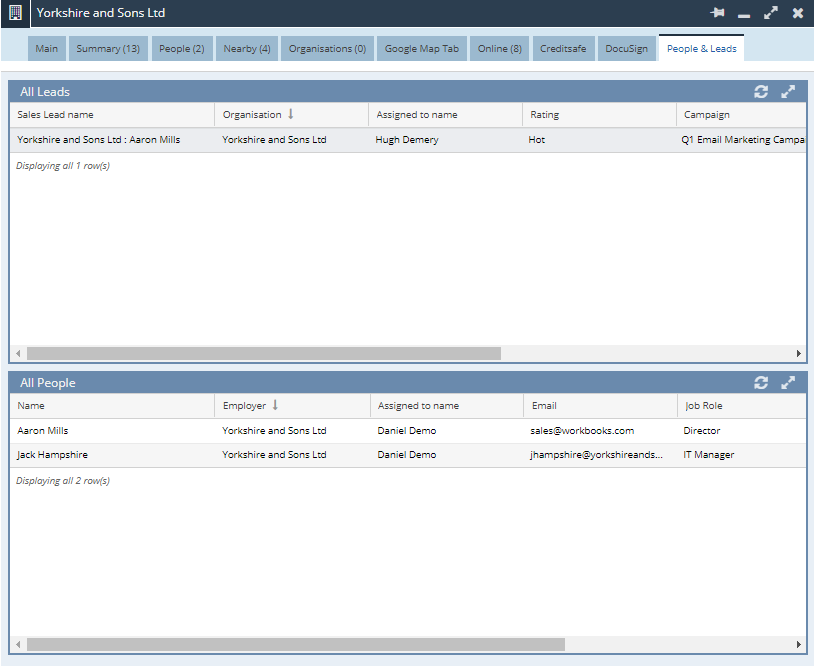
A worked through example and further information on how these new Field Types can be configured is found on our Knowledge Base.
Custom Records
Customers can now extend Workbooks with their own record types. Custom records behave like the built-in record types in Workbooks with a large number of common behaviours: reporting, import, export, form layouts, search, capabilities and permissions all work as you would expect. These come complete with their own object-reference prefixing.
Examples of where you might use a custom record include:
- An Asset record type to support an asset register;
- Configuration stores;
- Simple timesheets;
- Storing additional information alongside a main record.
Custom Records can be used as an alternative existing record types to fulfil a number of different roles. Re-purposing an existing record type is recommended when you need special behaviour which is built into that record type; if you do not then you should create a new Custom Record type.
Custom Records will be available for all customers with a Pro licence, and are available separately as an Extension. For more information on Custom Records, please review our Knowledge Base and Pricing Pages.
Views
Advanced Filtering
Custom Filters can be applied to Landing Pages and Report Views, these Custom Filters allow you to use Boolean operators to create complex filters that go beyond matching all or any of the Filters set. This provides you with the ability to create more intelligent Filtering without the need to create a Report with a calculated column.

Further information on how these can be configured is found on the Knowledge Base.
Reporting
Display Settings for Currency & Number Columns
When adding a Column to a Report you will be able to access new ’Display as’ settings from the Advanced tab. Changing the ‘Display as’ to a Currency or Number will provide you with the ability to amend the number of decimal places shown or display the value followed by a K or M for thousands or millions respectively.
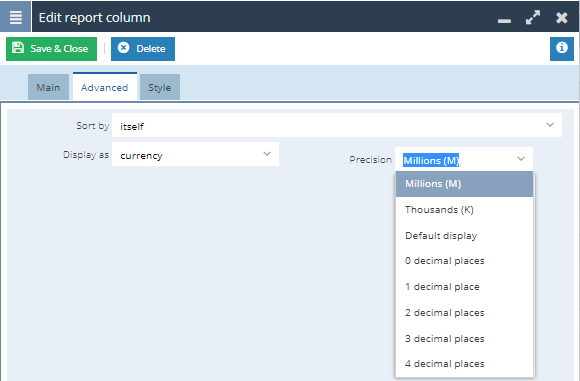
Refresh Reports
You can now trigger Reports to be refreshed when you create, modify or delete a Record of a specific type, this refresh will take place for a User when they perform one of these actions. This means that if the Report is being used as a “to do” list, once a user performs one of these actions on a Record the Report will automatically refresh, so they will see the most up to date information. This mirrors how Landing Pages currently work.

Once this is configured when this Report is open it will refresh in the background every time the selected Record Type is updated. Different Views can be refreshed by Different Record Types providing that the Record Type is included in the Report.
Edit Report in the Same Window
When editing a Report, rather than a new window being opened, the view within the existing window will change to Edit mode. Additionally, we have replaced Save & Close on the Edit window with Save & Run, this will then change from Edit mode to View mode.
This will help keep the number of windows to a minimum when editing and testing Reports and improve overall performance to stop the Report being run twice.
Custom Targets
It is now possible to use Custom Columns as a way to set targets in a Report, these can be either single value targets specified on a Record’s Field or use calculations built within the Report. To access this new feature select the “Get target values from another column” option when setting the Target on a Report Column.
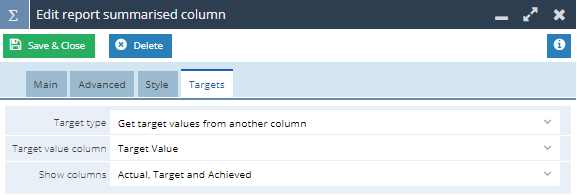
We have documented this new feature fully, including examples on our Knowledge Base.
Add to dashboard button
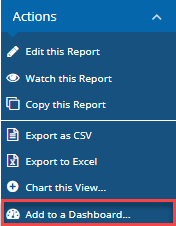
Report Views can be added directly to an existing Dashboard using the ‘Add to a Dashboard…’ Action. This allows you to select a Dashboard and give the Report View a new Title. It will then automatically be added to the top of the left-hand column within the Dashboard.
Icon Change
We have changed the Reporting Icon in both Modern and Classic Version of Workbooks, they will now appear as a grid rather than a Bar Chart.

Import
Automatic File Format detection
By default when creating a new Import the CSV File Format and Character Set picklists will be set to Automatic. When the Import file is submitted to Workbooks the Import tool will analyse the uploaded file and determine the best character set and file format to use. This is designed to save you a great deal of time, especially if you are using older versions of Windows or MacOS.

Recent Items
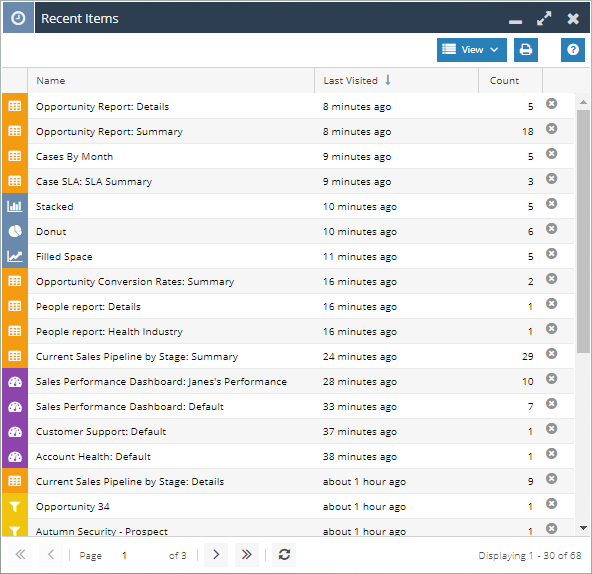
Dashboards, Charts and Reports can now be found in Recent Items
Charts, Reports and Dashboards will now appear in your Recent Items making these easier to find if closed by accident or required again after a short period of time.
