Report Card View
Display your Reports and Dashboards with Card View to give you an easy to read view that pulls through targets, images and your colour formatting.
Landing Page Report Views & Card View within Reports
Card View can be used in within Reports.
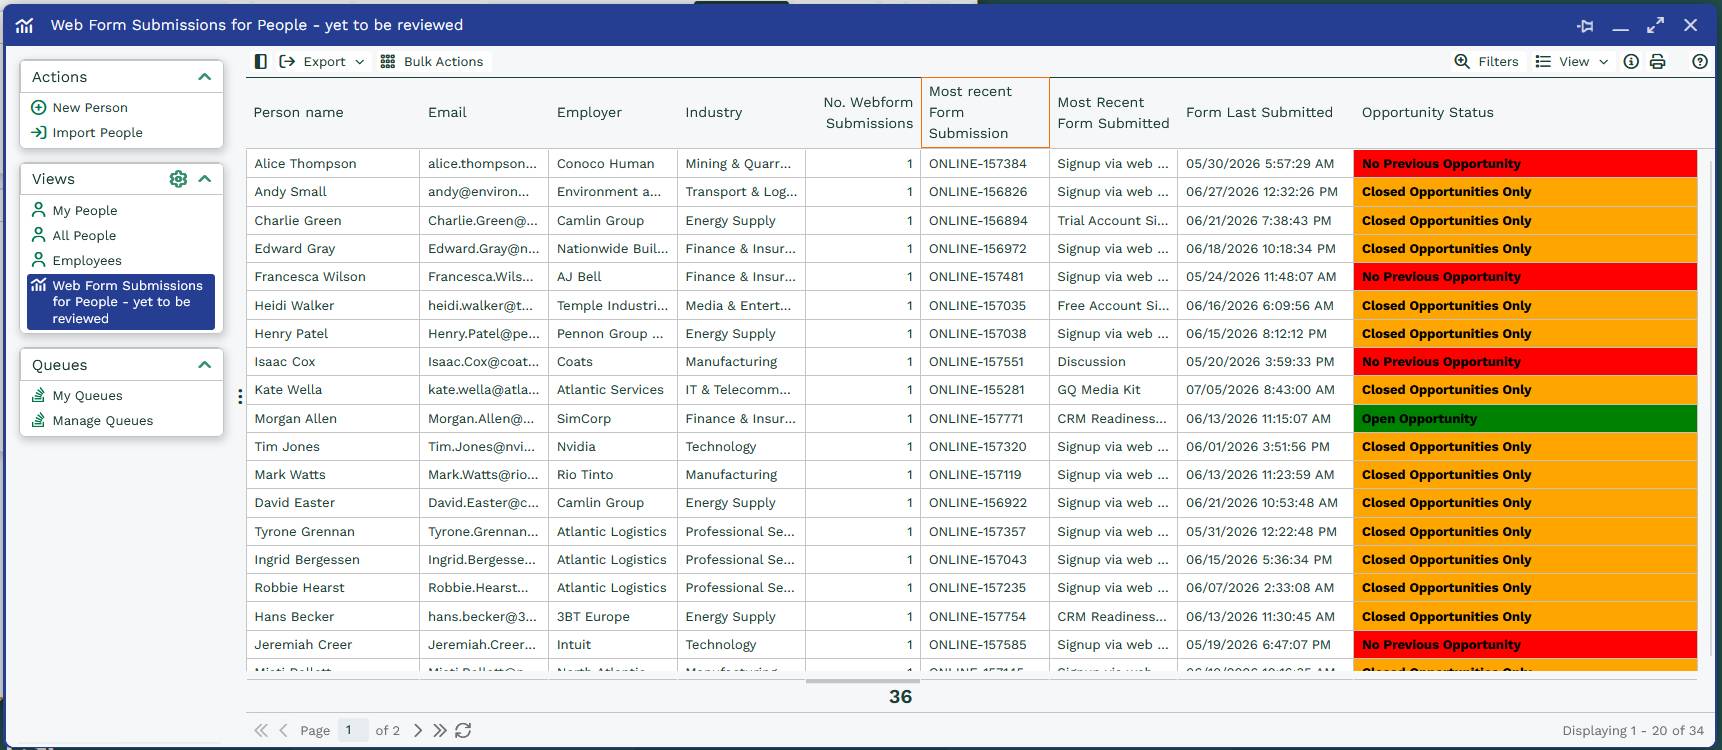
Before switching over to Card View, within a report you need to make sure that all the fields you want to see in the Card are shown.
Once you have the report ready to go, you will need to switch from a report view to the Card View which can be done by clicking View on the top right of the Report, then select View as Cards. If the Card View has not been configured on the report before, the drag and drop editor will appear straight away. If it has been configured, it will show the view as a card. Follow the steps on the Landing Page Card View page to configure the cards how you want.
This example shows what the report can look like in Card View on the Single Card with Image option.
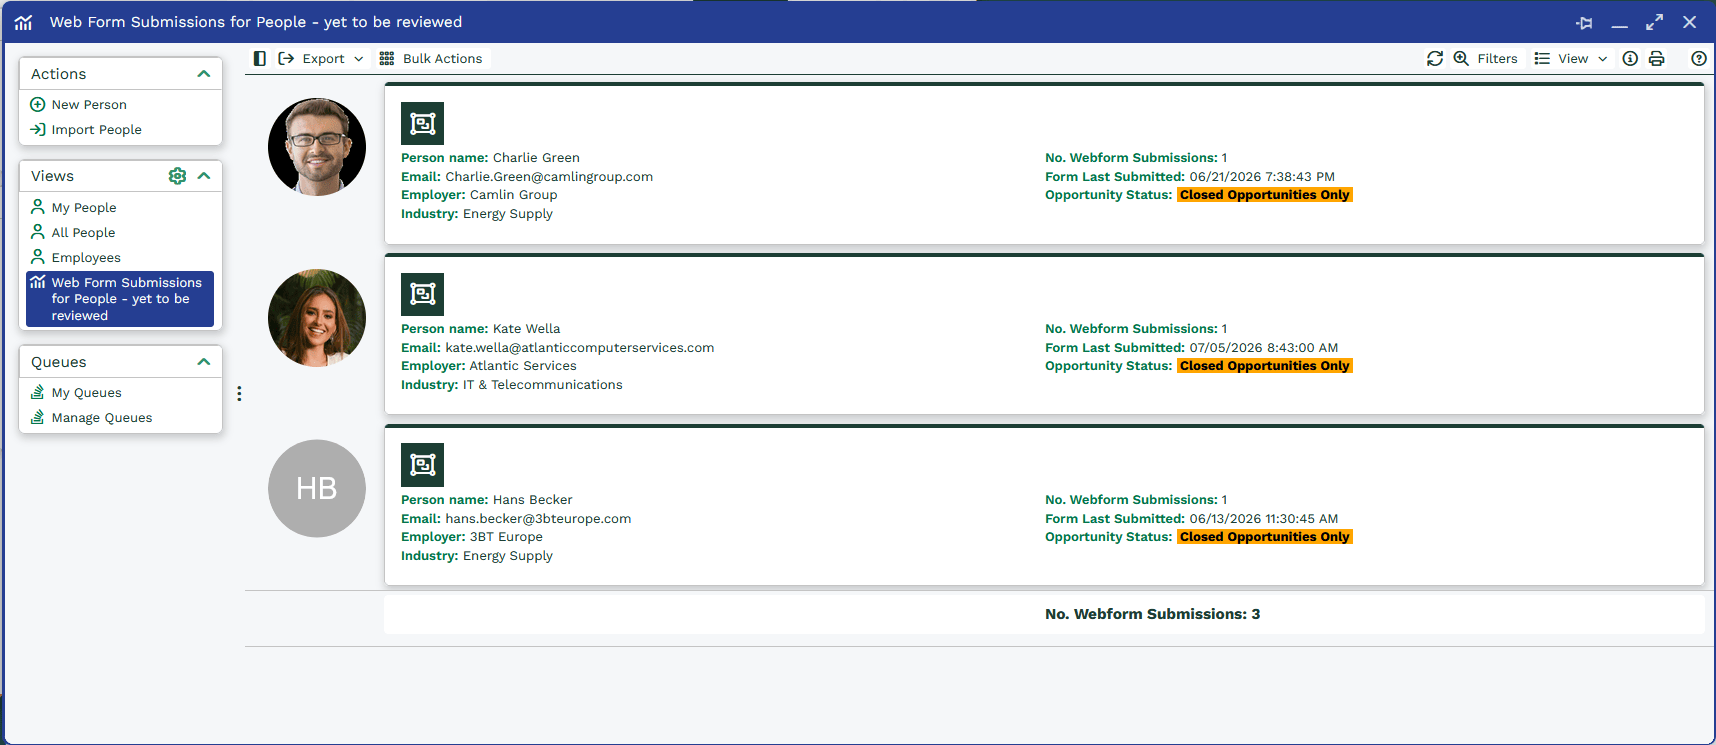
This example shows what the report can look like in Card View using the Single Card option and is configured the same way as a Landing Page report view (see the link above).
A few things to note:
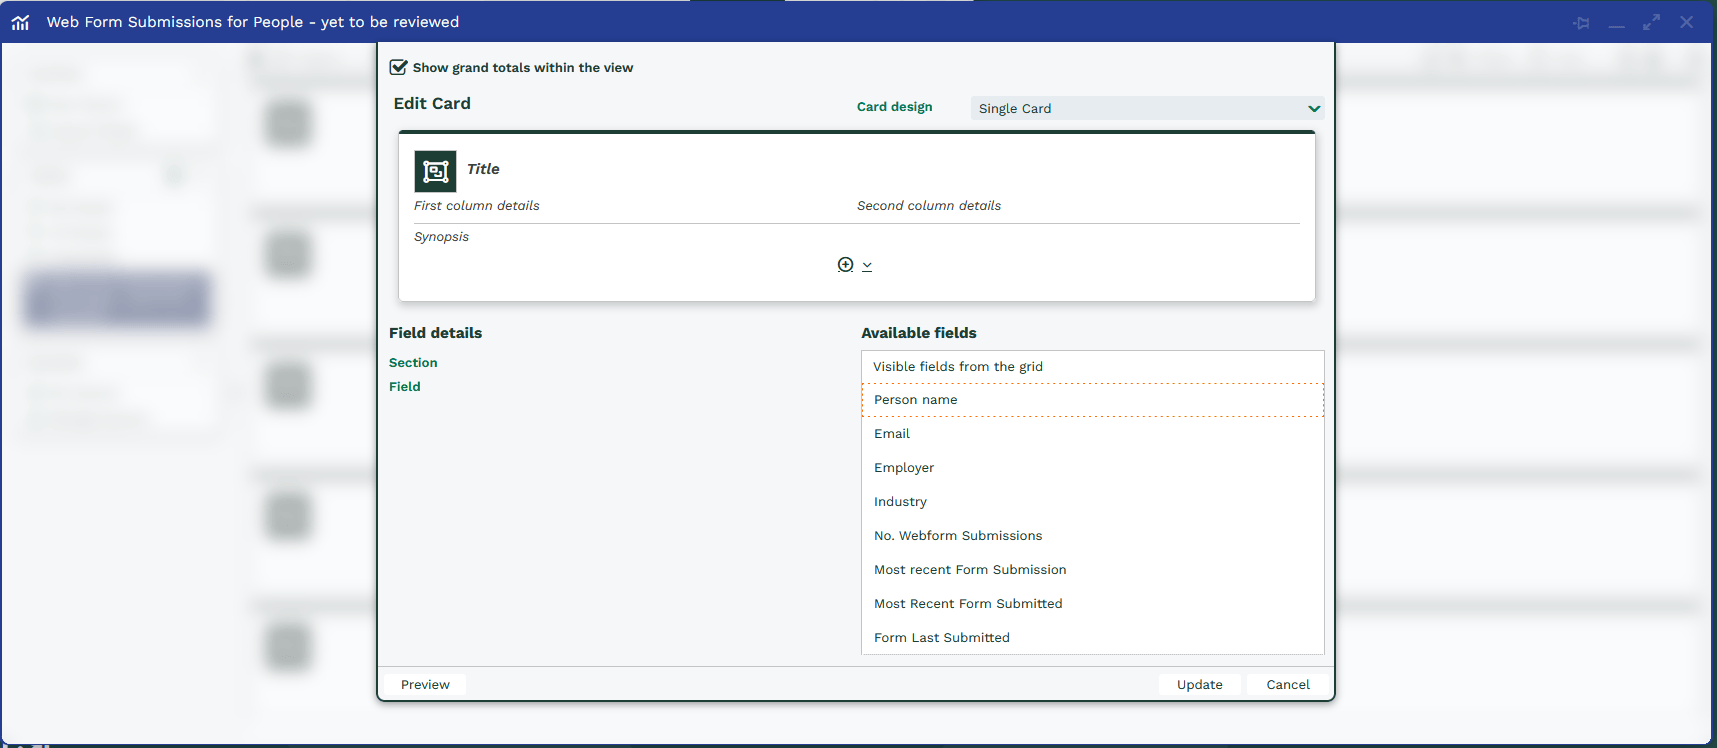
- Within the drag and drop editor for reports the ‘Available Fields’ are the names of the columns, and not field names. This means they can be edited specifically for a card view to show what you want.
- Underneath the ‘Field Details’ section on reports, another section will be shown named ‘Report Options’. The checkbox shown will give you the option to ‘Show grand totals’, which then totals the column you want.
- Icons cannot be changed on reports to suit whichever record they a based on/drilling through to. The standard report icon will be shown as per above screenshots.
- Profile pictures can be added into a Card by adding the photo into the report.
Card View within Dashboards
Reports on Dashboards can also be edited to show cards.
Find the Report within the Dashboard you want to view as cards.
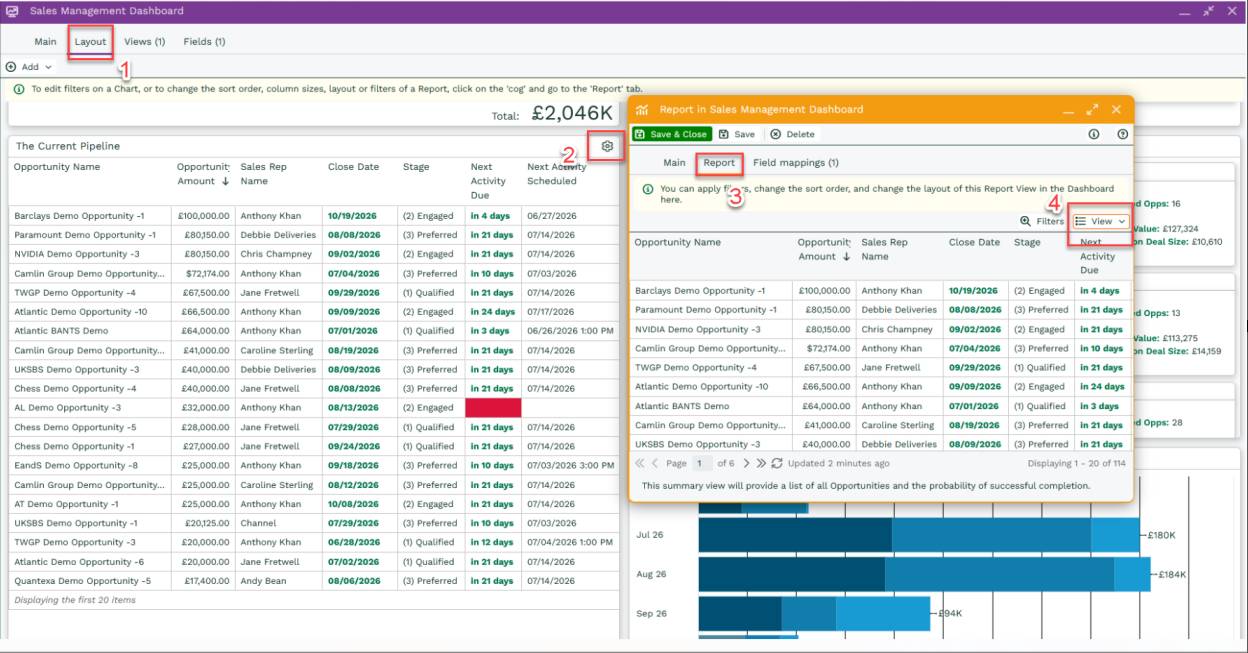
To change to Card View, you will need edit Permissions on the Dashboard. Within Edit mode, go into the Layout tab and hovering over the report you want to change will show a cog symbol, click on this. A new window will open, click on the Report tab, then within View you will be given the option to View as Cards.
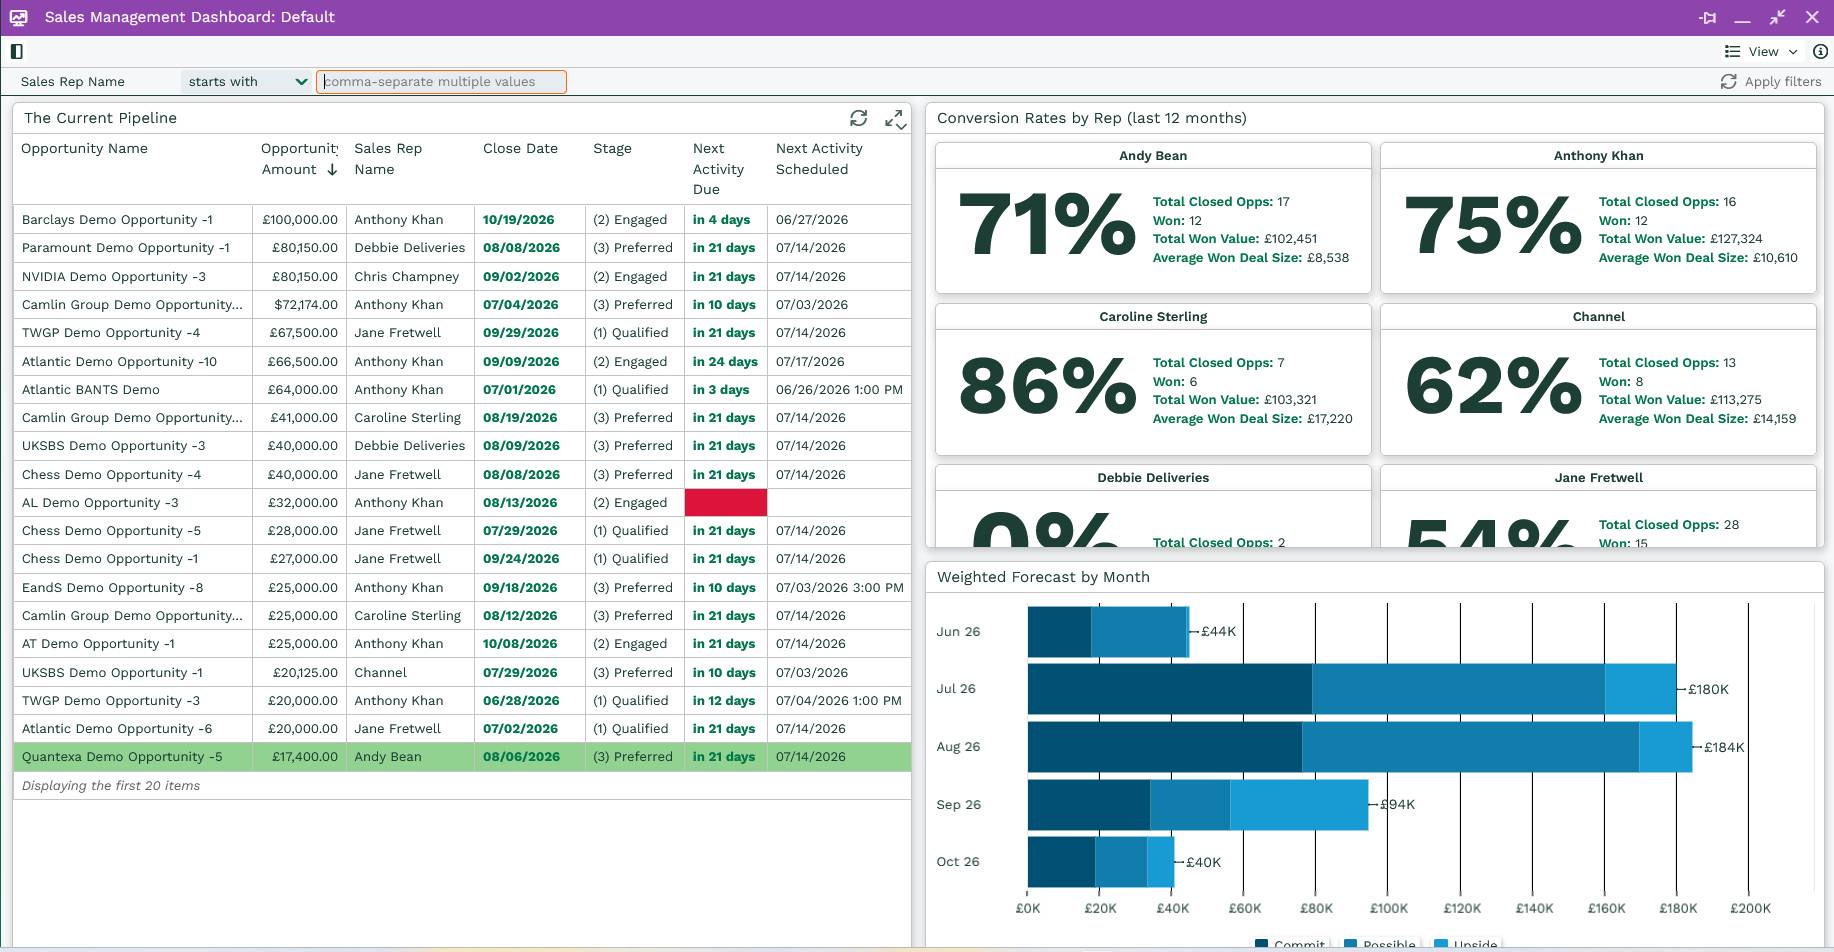
This example shows fields what the Dashboard can look like in Card View on the Multi-Card option.
A few other examples of what options that can be used on Card View:
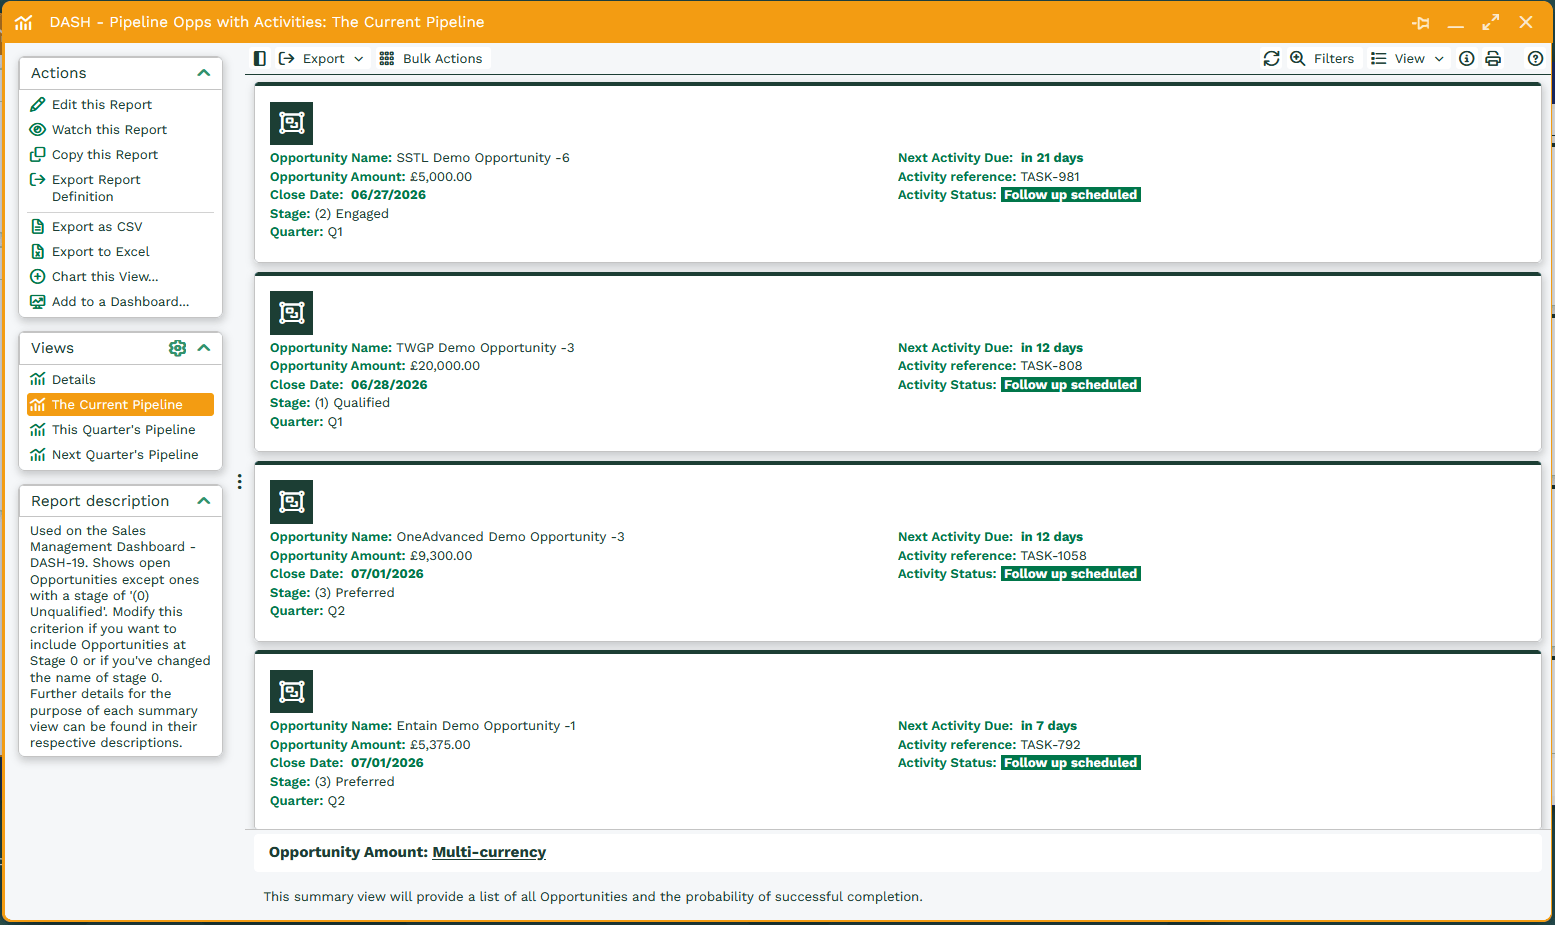
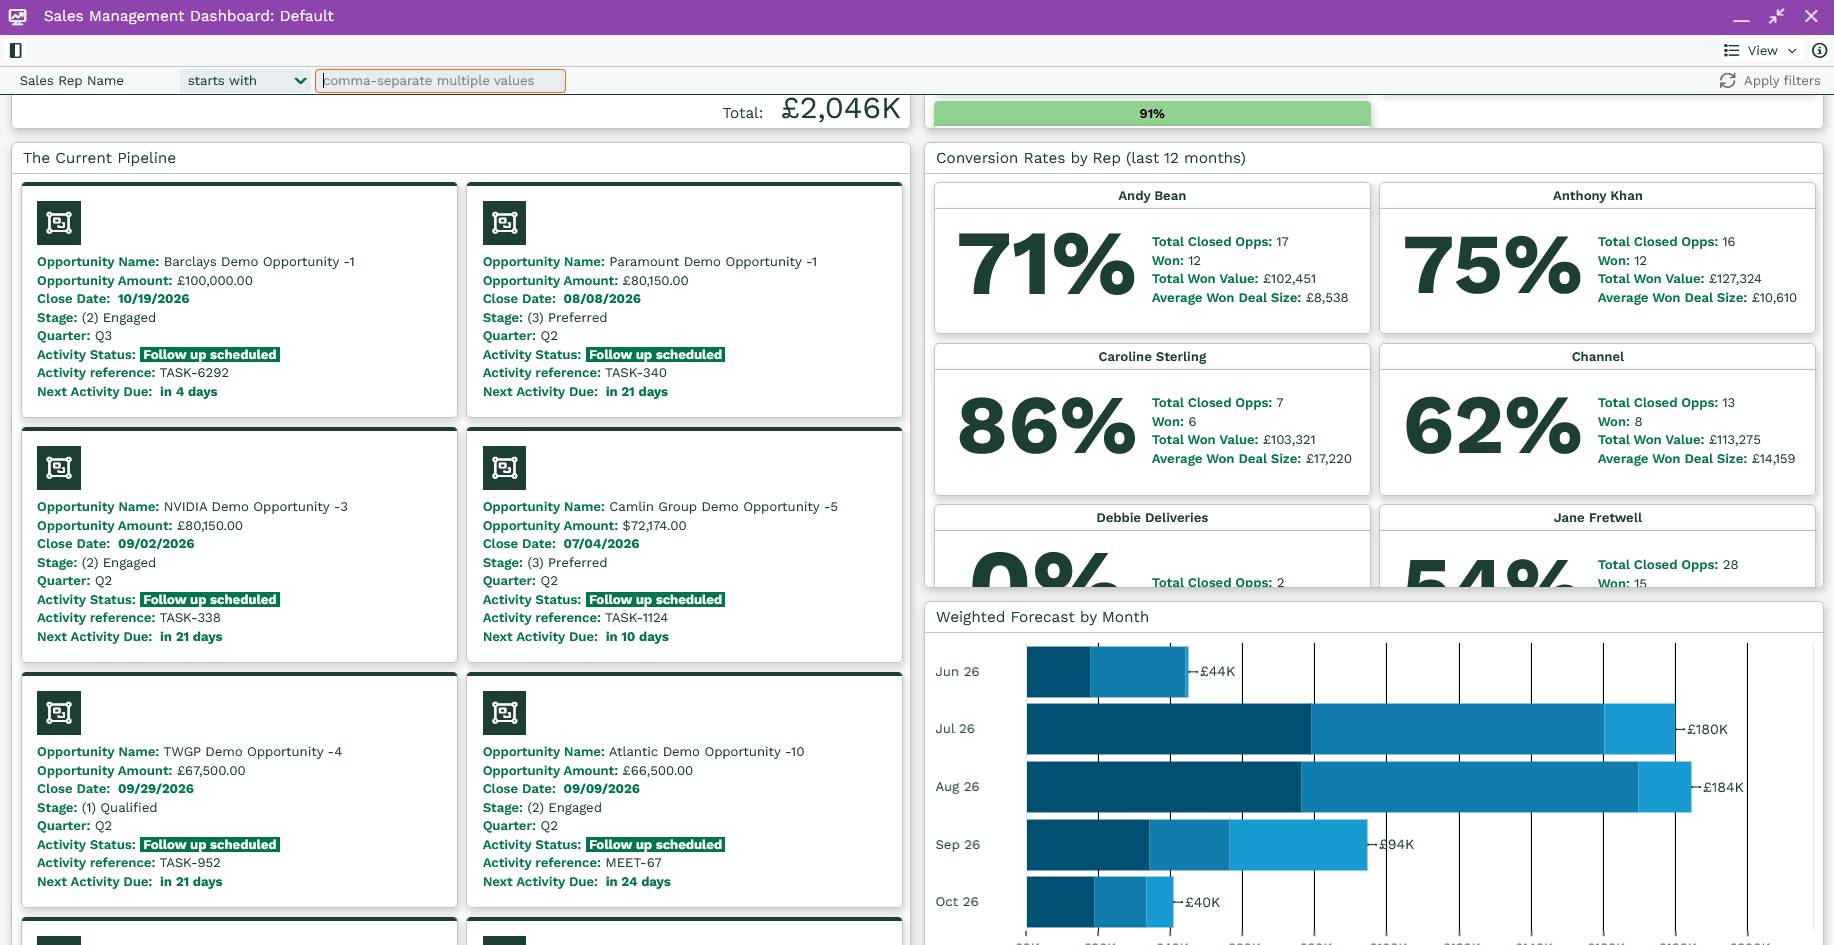
- Single Card with banner & image – the below example shows information on the Opportunities on the left columns and information on the latest Activity linked on the right. The banner at the top shows the status of the Activity in CSS styling, while the synopsis at the bottom gives you the description of that Activity. The image shown is the logo of the Organisation that is linked to the Opportunity, which if blank, will show the initials.
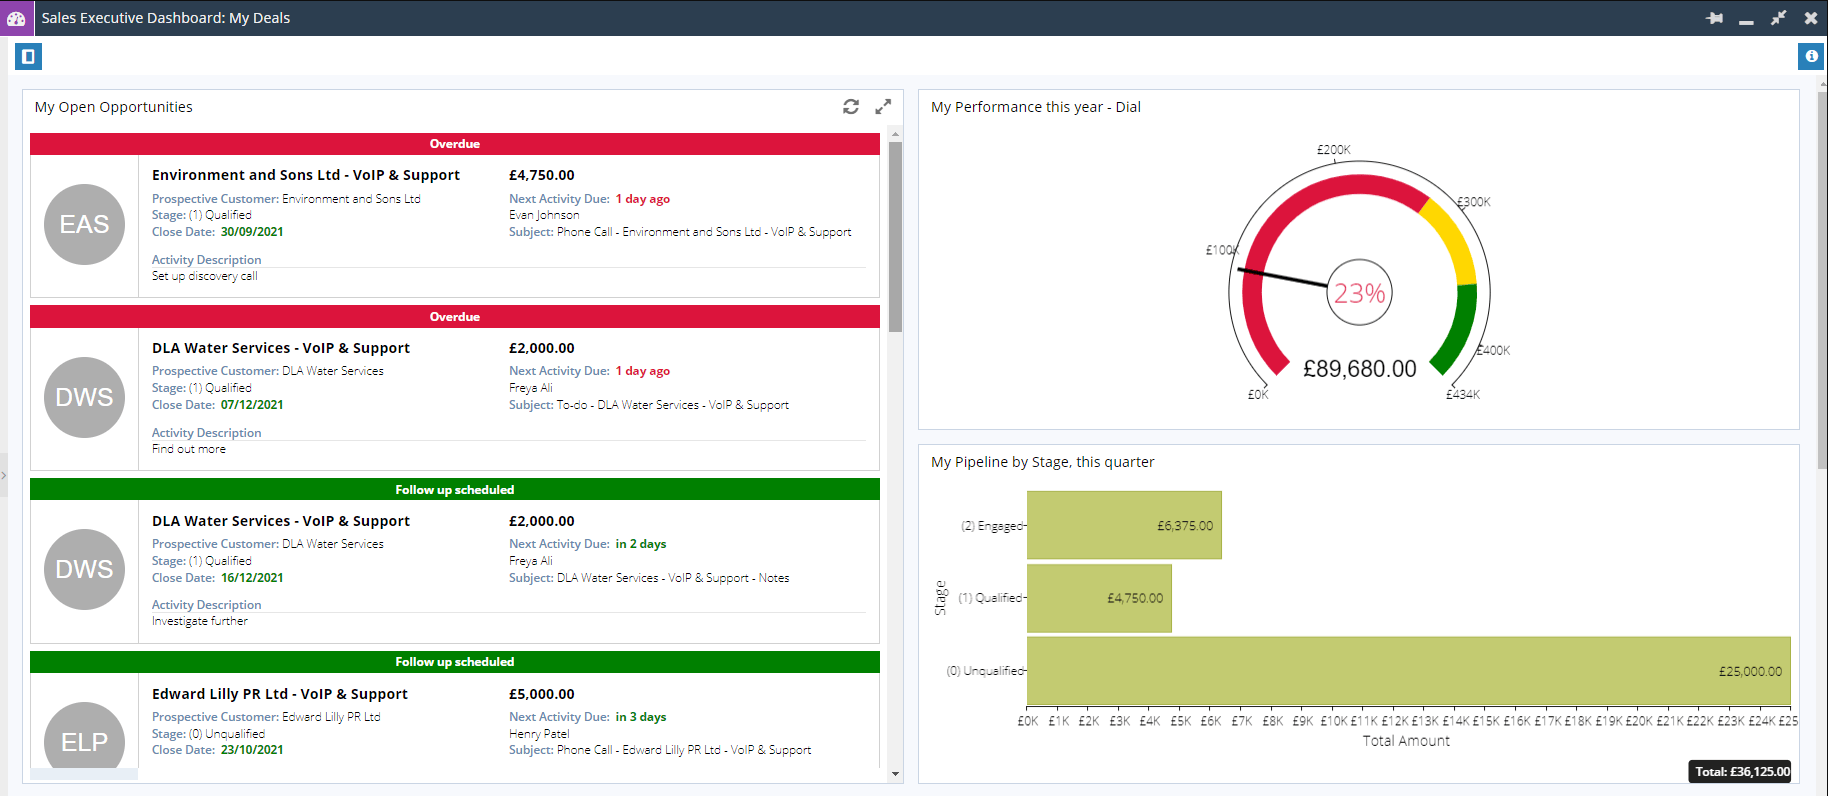
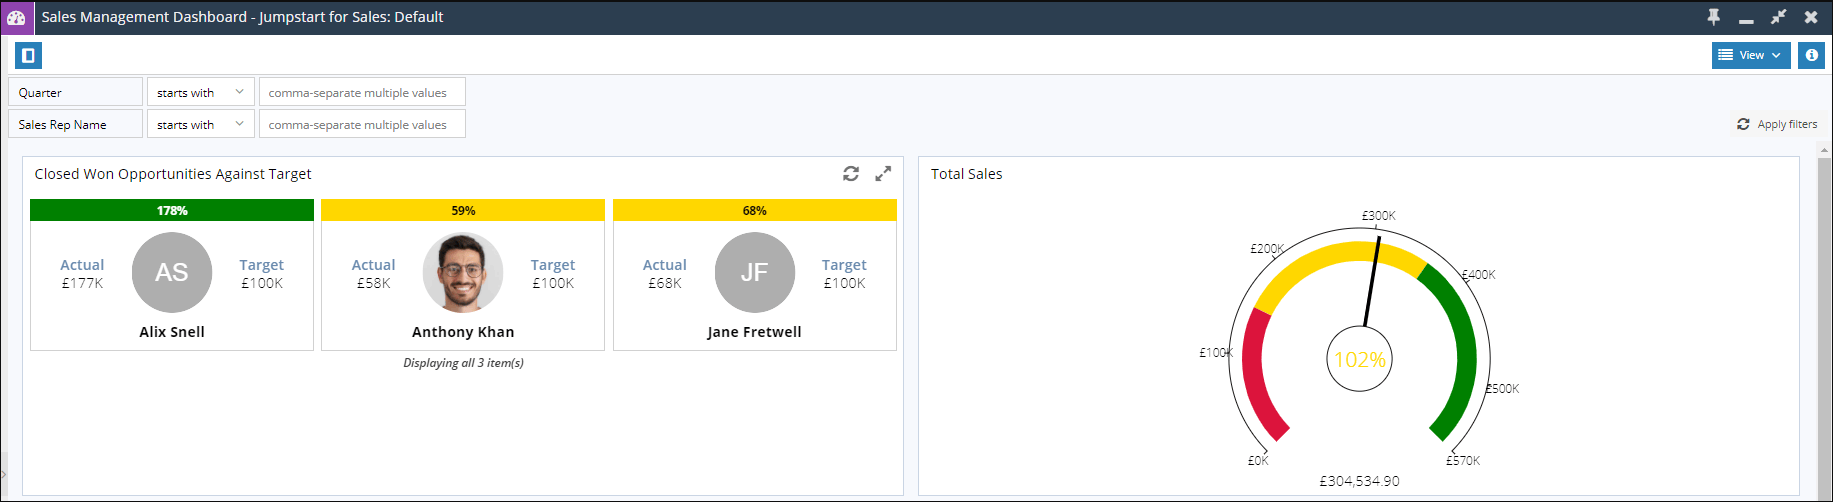
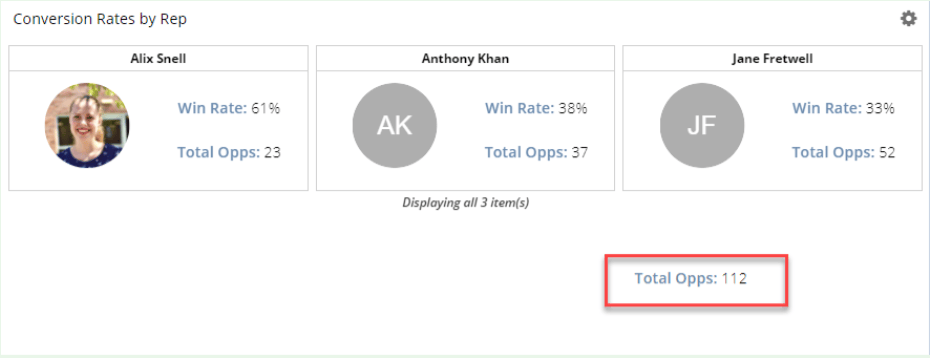
- Multi-Card with banner & image (centred) – the below example shows the actual performance of sales on Opportunities, compared to the target given to that User, with the User profile picture in the middle. The banner at the top is showing the CSS styling of a percentage of the two other fields shown, with the Users name at the bottom. As mentioned above, any of this fields can be changed, however, do need be in the report to be able to add to the card.