


Knowledgebase articles
- Welcome to the Knowledge Base
- Introduction
- Training
- Getting Started
- Preferences
- Activities
- Cases
- Importing Data
- Leads
- Marketing
- Introduction to Marketing
- Marketing Campaigns
- Mailing Lists
- Products
- Mailshots
- Upload Library
- Templates
- Event Management
- Compliance Records
- Force24
- Spotler Integration
- What is Spotler?
- Navigating your Spotler homepage
- GatorMail
- GatorLeads / Web Insights
- Tracking Code
- Setting up the Plugin
- Viewing Web Insights Data on your Form Layouts
- Domain Names and Online Activities
- Reporting incorrect Leads created through Web Insights
- Reporting on Web Insights data
- Using UTM Values
- Why aren’t Online Activities being created in the database?
- Why is GatorLeads recording online activities in a foreign language?
- GatorSurvey
- GatorWorkflow
- GatorPopup
- Opportunities
- Projects
- Integrations
- Mapping
- Electronic Signing Tools
- Creditsafe Integration
- Zapier
- Introduction to Zapier
- Available Triggers and Actions
- Linking your Workbooks Account to Zapier
- Setting up Zaps
- Posted Invoices to Xero Invoices
- Xero payments to Workbooks Tasks
- New Case to Google Drive folder
- New Case to Basecamp Project
- New Workbooks Case to JIRA Ticket
- Jira Issue to new Case
- 123FormBuilder Form Entry to Case
- Eventbrite Attendee to Sales Lead and Task
- Facebook Ad Leads to Sales Leads
- Wufoo Form Entry to Sales Lead
- Posted Credit Note to Task
- QuickBooks Online
- Survey Monkey responses to Tasks
- Multistep Zaps
- Email Integrations
- Event & Webinar Integration Tools
- GoToWebinar
- ON24
- Microsoft Office
- Outreach
- Installation
- Outreach Authentication
- Sync People to Outreach Prospects
- Sync Organisations to Outreach Accounts
- Sync Workbooks Opportunities to Outreach
- Sync Tasks/Activities from Workbooks to Outreach
- Sync Outreach Sequences to Workbooks
- Sync Outreach Sequence States to Workbooks
- Sync Outreach Sequence Step Numbers to Workbooks
- Sync Prospects/Accounts/Opportunities from Outreach to Workbooks
- Sync Outreach Tasks/Calls/Meetings to Workbooks
- Scribe/Workbooks Connector
- RingCentral
- Auditing
- Comments
- People & Organisations
- Reporting
- Introduction to Reporting
- Using Reports
- Introduction to Charts
- Exporting Reports
- Advanced Reporting
- Report Snapshots
- Dashboards
- Transaction Documents
- Introduction to Transaction Documents
- Displaying & Adding Transaction Documents
- Copying Transaction Documents
- Transaction Documents Fields Help
- Transaction Documents Line Items Help
- Printing & Sending Transaction Documents
- Managing Transaction Document Currencies
- Managing Transaction Document Statuses
- Setting a Blank Default Currency on Transaction Documents
- Credit Notes
- Customer Orders
- Invoices
- Quotations
- Supplier Orders
- Contract Management
- Sagelink
- Introduction to Transaction Documents
- Configuration
- Introduction to System Administration
- Users & Security
- Database
- Accounting
- Email Integrations
- Customisation
- Creating & Modifying Picklists
- Theme
- Record Types
- Creating Custom Fields
- Report-based Custom Fields
- Linked Fields & Reference Fields
- Record Templates
- Form Layouts
- Customising relationships between parties
- Opportunity Stages
- Custom Records
- Sign In Customisation
- Automation
- Contact Support
- Releases & Roadmap
Targets on Bar Charts
Overview of how Targets from Report Views can be reflected within a Bar Chart.
Once you have created a Bar Chart, it is possible to show the Targets from the Report on the Chart. By default, when creating a Bar Chart, the Targets will not be shown.
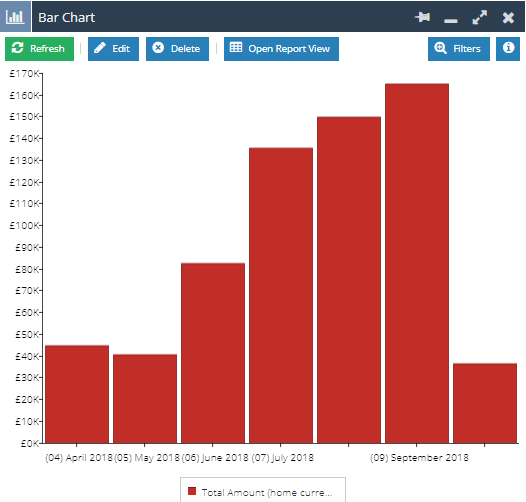
When editing the Bar Chart you will see a ‘Show Targets’ picklist within the Targets section with three options: ‘No’, ‘Yes’ and ‘Yes with conditional styling’.
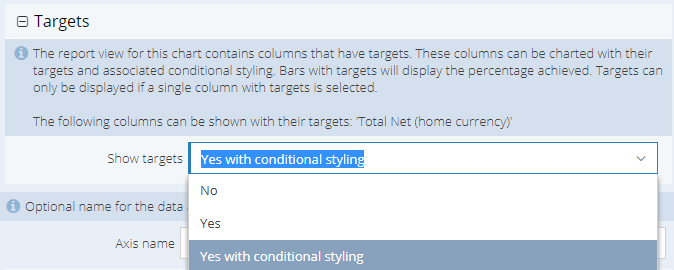
Note: This section will only be available if the Report View has a Target configured within it.
Charts with Targets
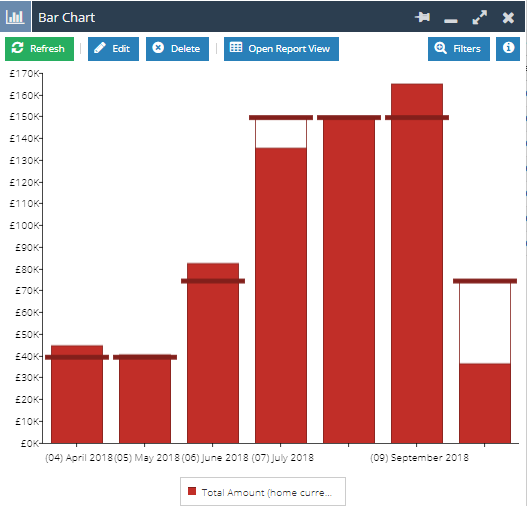
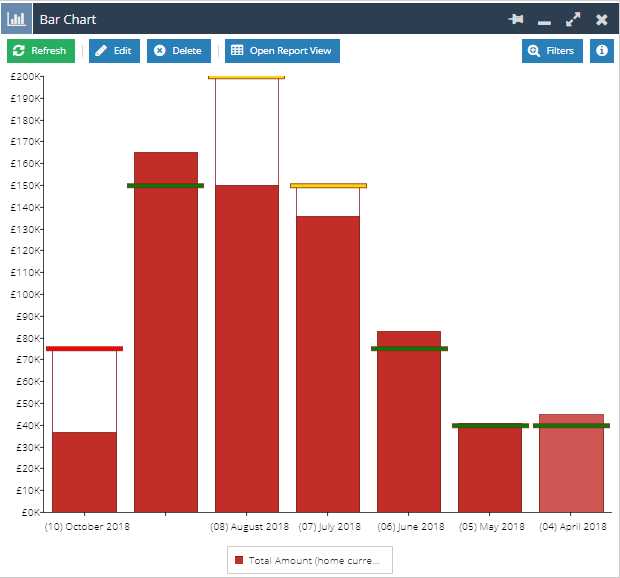
Changing this setting to Yes will create a Target bar that will appear in line with the value of the Target for the corresponding row of the Report. This allows you to see the actual data in comparison to the Target.
Charts with CSS Styling
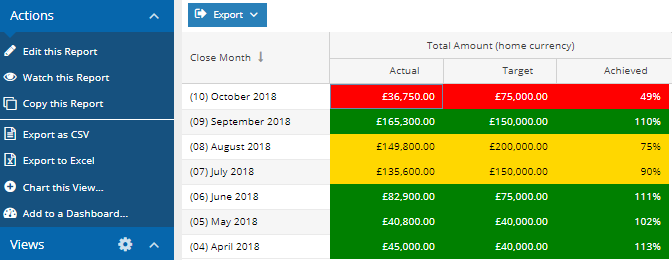
CSS Styling is an excellent way to see how close to achieving a Target you are, as it applies colour coding depending on the performance against target. This styling can then be pulled from the Report to the Bar Chart in one of two ways.
If you have set the ‘Show Targets’ setting to ‘Yes’, as well as having Styling configured on the Report, this will appear as below, showing a Target line across the Bar. However, the target bars will appear in the appropriate colour.
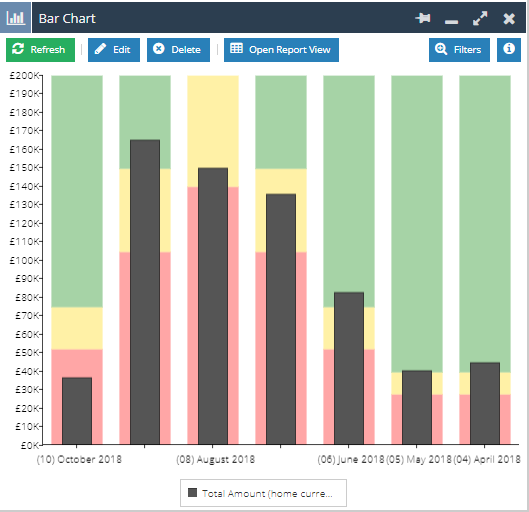
There is an additional Target setting for when CSS Styling is configured on the Report View, ‘Yes with conditional styling’. Rather than create a target line across the bar, this creates a background against the bar with the Red, Yellow and Green values appearing at the appropriate values.
You can learn more about creating and using charts in the video provided here: https://www.workbooks.com/resource-documents/creating-charts/